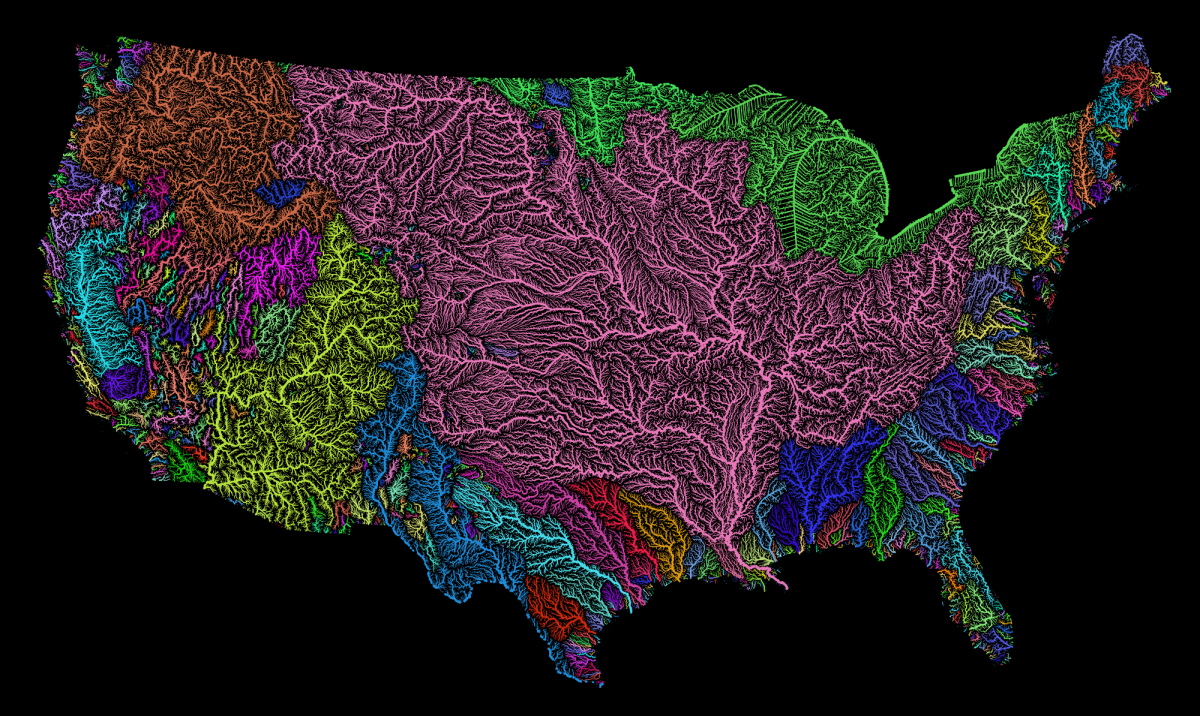
This is a sight for sore eyes. Created by Hungarian geographer and map-designer Robert Szucs, using open-source QGIS software, the high resolution map above shows:
all the permanent and temporary streams and rivers of the contiguous 48 states in beautiful rainbow colours, divided into catchment areas. It shows Strahler Stream Order Classification. The higher the stream order, the thicker the line.
When you look at the map, you’ll see, as The Washington Post observes, “Every river in a color drains to the same river, which then drains into the ocean. The giant basin in the middle of the country is the Mississippi River basin. Major rivers like the Ohio and the Missouri drain into the behemoth.” Pretty impressive.
The map was apparently made using data from the European Environment Agency and the Rivers Network System.
You can find the map on Imgur, or purchase “ultra high” resolution copies through Etsy for $8.
Szucs has als0 produced data visualizations of the river systems in China, India, Europe and other parts of the world.

If you would like to sign up for Open Culture’s free email newsletter, please find it here. Or follow our posts on Threads, Facebook, BlueSky or Mastodon.
If you would like to support the mission of Open Culture, consider making a donation to our site. It’s hard to rely 100% on ads, and your contributions will help us continue providing the best free cultural and educational materials to learners everywhere. You can contribute through PayPal, Patreon, and Venmo (@openculture). Thanks!
Related Content
Ancient Rome’s System of Roads Visualized in the Style of Modern Subway Maps
Japanese Designers May Have Created the Most Accurate Map of Our World: See the AuthaGraph
Buckminster Fuller’s Map of the World: The Innovation that Revolutionized Map Design (1943)

Weird. What’s with the straight black line across the top of the map? Is that where Outer Space begins?
I find the Great Lakes region confusing. Compare with the Gulf, where each drain into the Gulf is a different color, but each drain into the Great Lakes is the same color, and yet there is no VISUAL reason why this should be so.
Further it seems to be prioritizing political boundaries over geographic ones, along the Canadian and Mexican borders (some of which are in water) yet it arbitrarily excludes Alaska, Hawaii, and all the territories.
Hey,
Thanks for sharing first of all.
I love how people sometimes take offence in a US river map not showing rivers from Canada and Mexico. :) Nobody every complained that my Italy river map is not showing rivers of Slovenia. :) Anyway, I’d love to make a North America, Alaska and Hawaii version obviously, but sadly the data is not available. Neither for most of Canada.
As for the Great Lakes region, the reason it’s all the same color is that it’s the same river basin. St. Lawrence.