The age of the “universal history” has come and gone. The genre flourished in times when it seemed possible to assume a vantage point outside of time—to see purpose and pattern in thousands of years of human action. “It might be possible,” wrote Immanuel Kant, “to have a history with a definite natural plan for creatures who have no plan of their own.” The view assumed by such a history tends to exclude the circumscribed perspective of the viewer, or—in Ralph Waldo Emerson’s famous, and oft-parodied, phrasing, “all mean egotism vanishes. I become a transparent eyeball; I am nothing; I see all; the currents of the Universal Being circulate through me; I am part and parcel of God.”

Few historians today assume such a gods-eye-view, for better or worse, but without it, we would never have seen the development of its visual analogue: the timeline map, an infographic form especially popular in the 18th to the early 20th centuries, when thinkers from Schiller to Herder to Kant to Hegel to Marx to Weber produced universal accounts of human history that, to varying degrees, purported to account for vast historical developments as the movement of impersonal forces toward some definite goal.
From the perspective of the timeline map, civilizations grow naturally from each other like branches from a tree, or flow one into another like a river’s tributaries, or produce, as in John B. Sparks “Histomap,” colorful puzzles in which every piece has its neatly-assigned place….
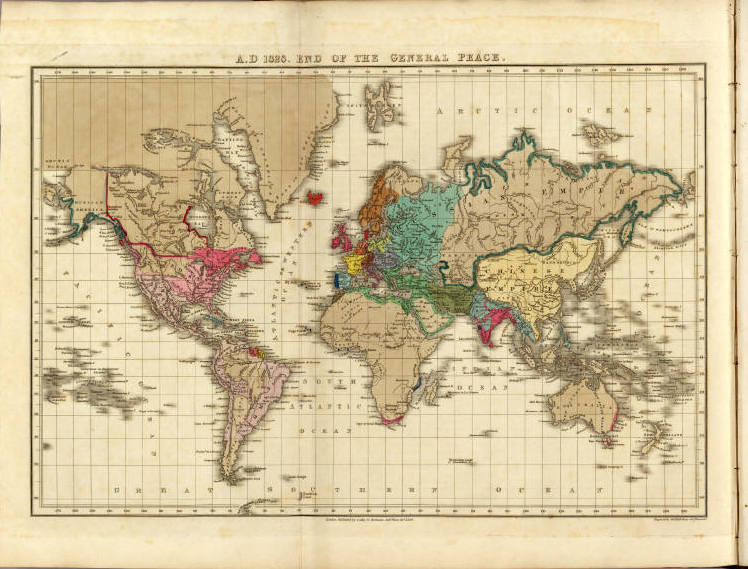
We’ve featured several such maps here, like the Histomap and Eugene Pick’s 1858 Tableau De L’Histoire Universelle, both from the extensive map collection of David Rumsey. In the version you see here, we have a very unusual variation on the theme—rather than a historical timeline map, Edward Quin produced in 1830 An Historical Atlas; In a Series of Maps of the World as Known at Different Periods.
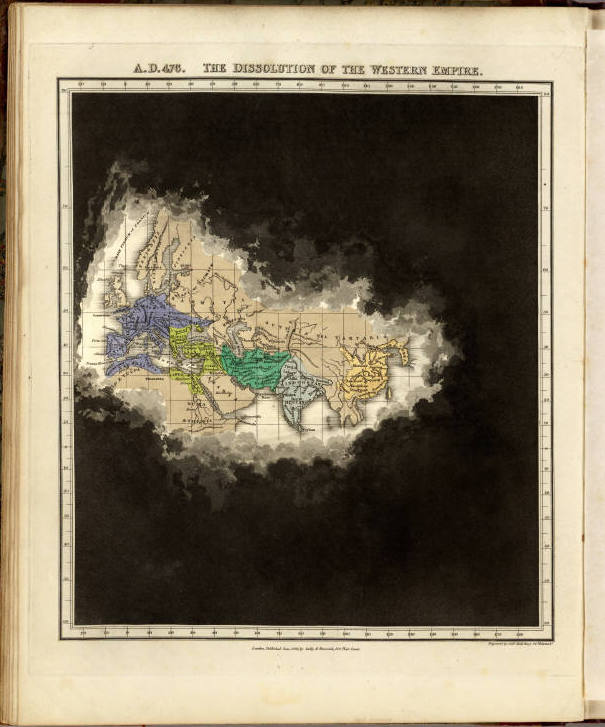
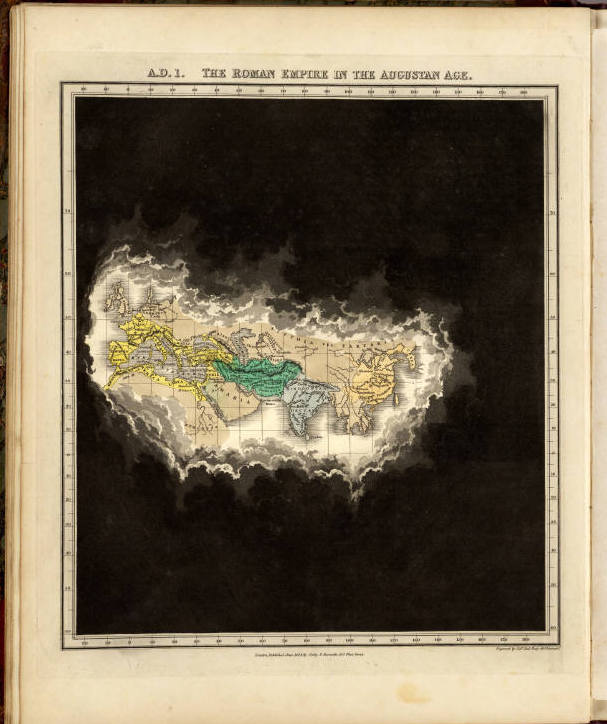
The question, “as known by whom?” seems entirely relevant. The perspective of Quin’s atlas is godlike, gazing down at the world through the clouds, but unlike Emerson’s transparent view, it does not “see all”—those clouds occlude the vision, restricting it to indicate, as the Rumsey collection notes, “the expansion of geographical knowledge over time.” You’ll have to read Quin’s text—available here—to understand how he accounts for the chronology and perspective.
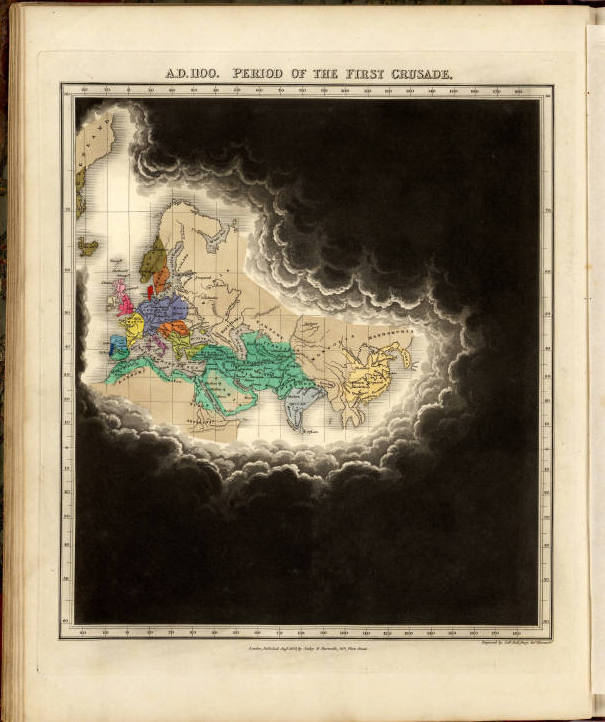
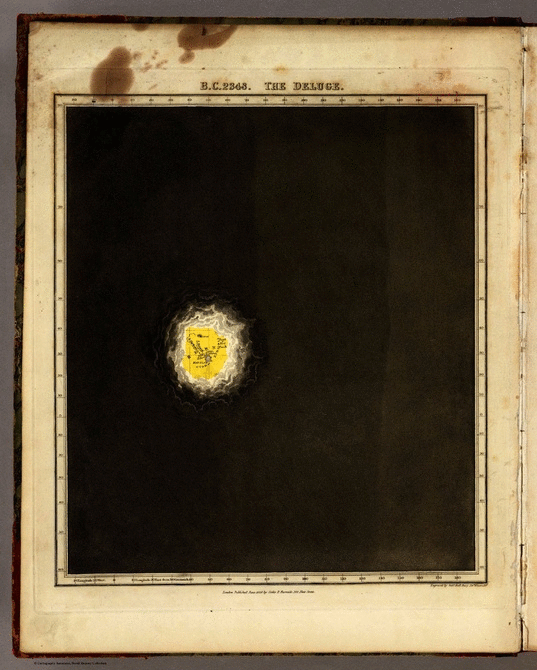
The atlas begins in 2348 B.C. with “the Deluge,” the mythical Biblical flood. Biblical history inexplicably gives way to the secular. In a description of the atlas by Donald A. Head rare books, this strange document “intended to cartographically depict political change from the time of creation to the year 1828,” when it reveals “the enlightened world in the midst of the Industrial Revolution…. Divided into twenty-one periods… the clouds fully disappear at the nineteenth period: ‘A.D. 1783 at the separation of the United States of America, from England.” In his preface, Quin explains his project in the typical terms of universal history, as illustrating “by the changes of colour the empires which succeed each other.”
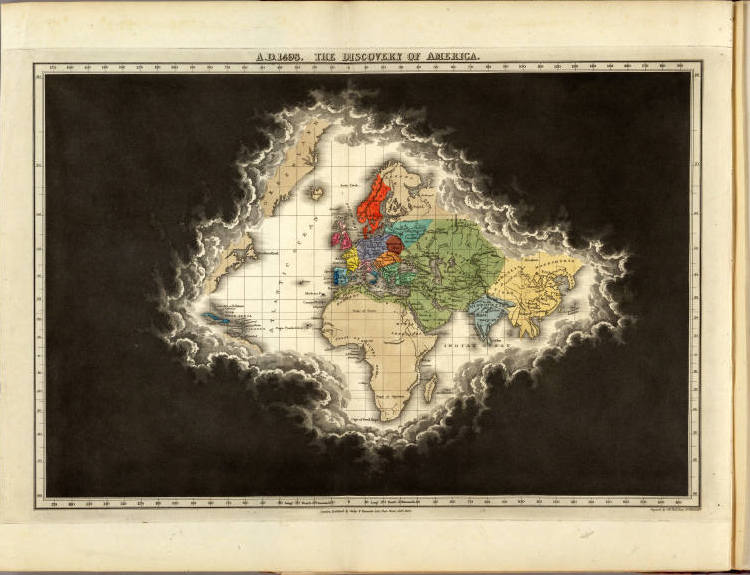
Quin’s description of the unchanging perspective he adopts might remind some modern readers of certain comic book characters as much as of the vision of a god or a transparent, detached eye: “Like the watchman on some beacon-tower, he views the hills and peopled valleys around him, always the same in situation and in form, but every changing aspect of the hours and seasons….” View Quin’s complete Historical Atlas, scanned in high resolution detail, at the David Rumsey Map Collection.
On our page here, see individual pages from the Historical Atlas. Or, up top, see an animated gif that lets you view all 21 maps in the atlas in chronological order.
Related Content:
4000 Years of History Displayed in a 5‑Foot-Long “Histomap” (Early Infographic) From 1931
Groundbreaking Map from 1858 Colorfully Visualizes 6,000 Years of World History
10 Million Years of Evolution Visualized in an Elegant, 5‑Foot Long Infographic from 1931
Josh Jones is a writer and musician based in Durham, NC. Follow him at @jdmagness
Leave a Reply