Few people have done more to accurately foresee and help shape the century ahead of them as W.E.B. Du Bois. And perhaps few intellectuals from the early twentieth century still have as much critical relevance to our contemporary global crises. Du Bois’ incisive sociology of racism in The Souls of Black Folk, Black Reconstruction in America, and his articles for the NAACP’s journal, The Crisis, remained rooted in a transcontinental awareness that anticipated globalism as it critiqued tribalism. Du Bois, who studied in Berlin and traveled widely in Europe, Africa, and Latin America, also became one of the most influential of Pan-Africanist thinkers, uniting the anti-colonial concerns of African and Caribbean nations with the post-Reconstruction issues of Black Americans.
In 1900, Du Bois attended the First Pan-African Conference, held in London at Westminster Hall just prior to the Paris Exhibition. Attendees presented papers on “the African origins of human civilization,” writes Ramla Bandele at Northwestern’s Global Mappings, on African self-government, and on the imperial aggression of European countries (including the host country). Du Bois arrived armed with what might have seemed like a dull offering to some: a collection of statistics. But not just any collection of statistics. Though they’re now an often banal staple of our everyday working lives, his presentation used then-innovative charts and graphs to condense his data into a powerful set of images.
Once again anticipating global trends of over a century hence, the activist and sociology professor at Atlanta University created around 60 eye-catching data visualizations, “charts and maps,” writes the blog All My Eyes, “hand drawn and colored at the turn of the 19th century” by Du Bois and his students.
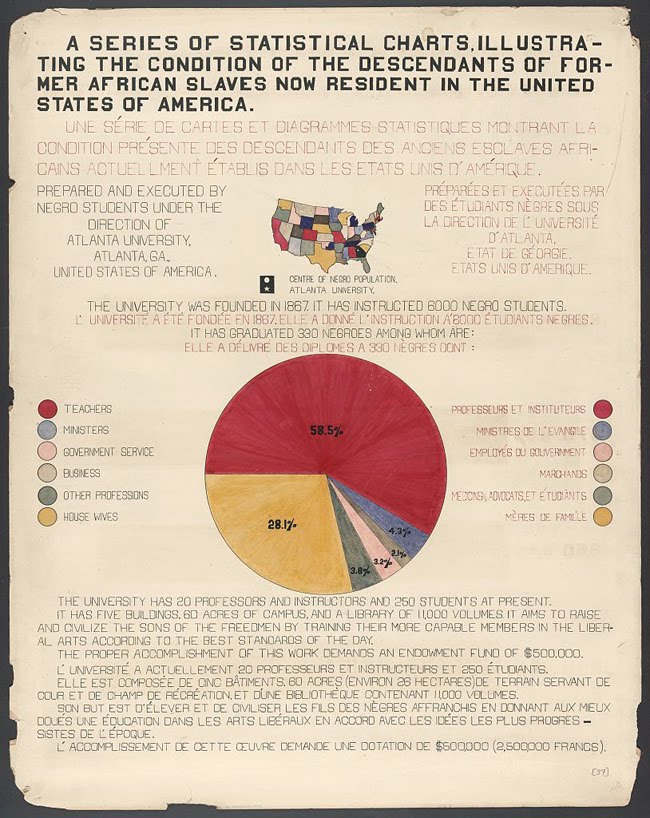
For audiences at the time, these must have packed the evidentiary punch that Michelle Alexander’s The New Jim Crow or Ta-Nehisi Coates’ “The Case for Reparations” have recently. Du Bois and his students’ charts show us—as the first “slide” at the top of the post notes—“the condition of the descendants of former African slaves now resident in the United States of America.”
The collection of infographics, Danny Lewis argues at The Smithsonian, “is just as revolutionary now as it was when it was first created,” for an exhibit Du Bois organized with a lawyer named Thomas J. Calloway and his occasional rival Booker T. Washington. “This was less than half a century after the end of American slavery,” writes Allison Meier at Hyperallergic, “and at a time when human zoos displaying people from colonized countries in replicas of their homes were still common.” In the U.S., the grotesque stereotypes of blackface minstrels provided the primary depiction of African-American life.
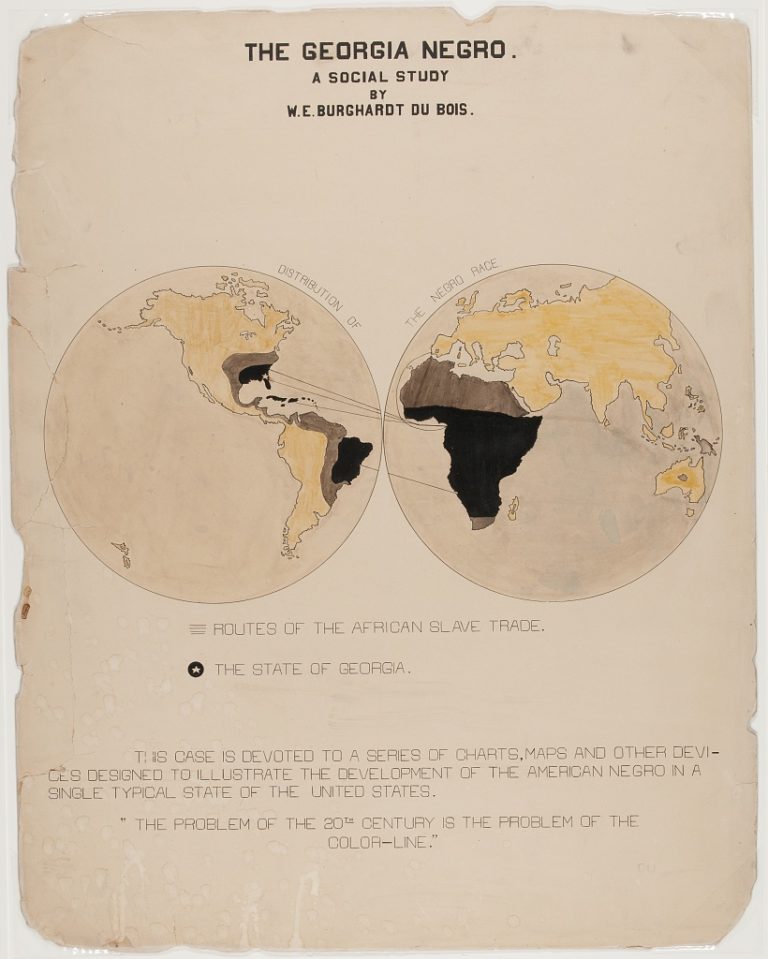
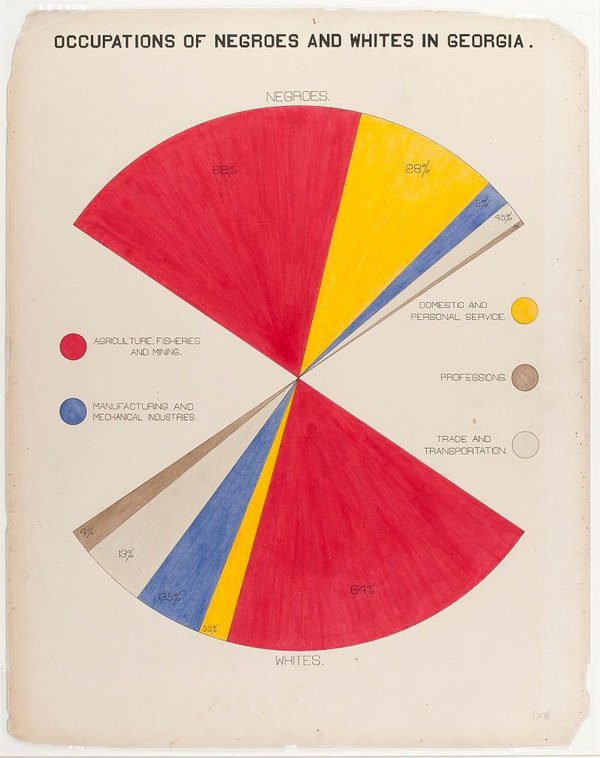
“Du Bois’ students,” writes data blog Seeing Complexity, “made a radical decision when they visualized the economic plight of a group explicitly excluded from statistical analysis and thus hidden from international attention.” The level of detail—for Du Bois’ time and ours—is overwhelming, reminding us that “the simple act of disseminating information can, in itself, be a radically and potentially transformative act.” In one of Du Bois’ graphic studies, “The Georgia Negro,” he quotes his key line from The Souls of Black Folk, “The problem of the 20th century is the problem of the color-line.” Far too much current data demonstrates that the statement still holds true in the 21st century, as gross disparities in wealth and in the criminal justice system grimly persist, or worsen, along racial lines.
Data may not be as transformative as Du Bois had hoped, but it forces us to confront the reality of the situation—and either rationalize the status quo or seek to change it. One of three parts of the exhibit, The Georgia Negro study was Du Bois’ “most important contribution to the project,” writes Professor Eugene Provenzo in his book on the subject. The charts are truly impressive for their distillation of “an enormous amount of statistical data,” drawn from “sources such as the United States Census, the Atlanta University Reports, and various governmental reports that had been compiled by Du Bois for groups such as the United States Bureau of Labor.” (Much of the data would have gone uncollected were it not for Du Bois’ tireless efforts.)
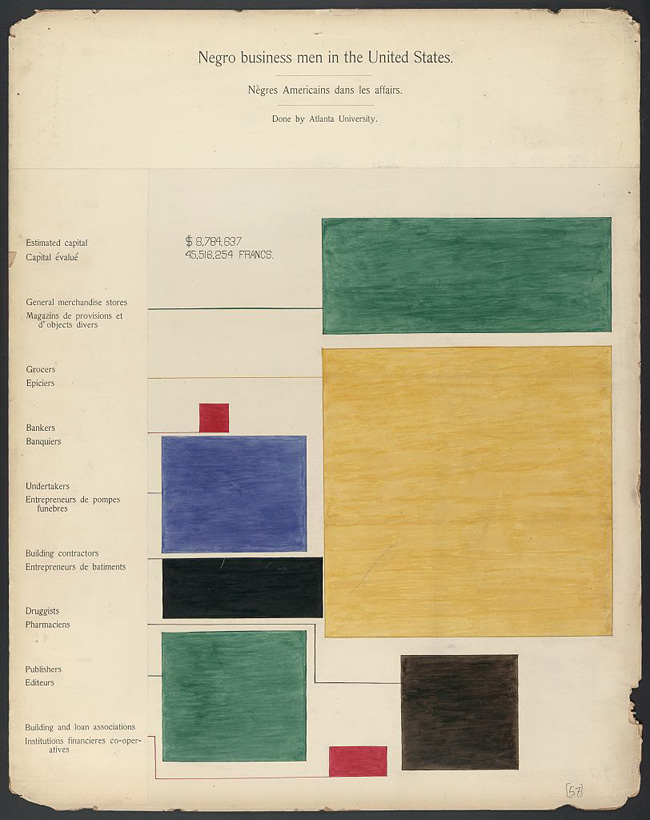
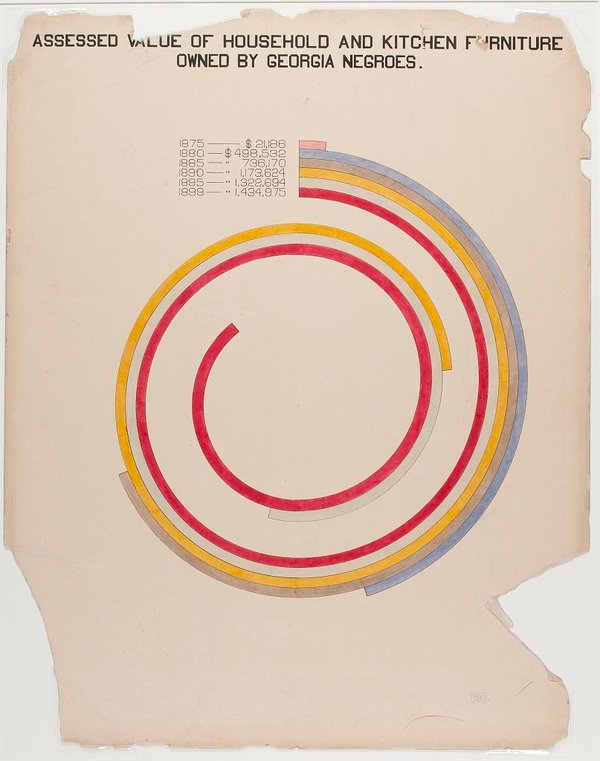
The charts are also, Provenzo notes, “remarkable in terms of their design,” as you can see for yourself. Du Bois and his students committed to “examining everything,” Meier writes, quoting Slate’s Rebecca Onion, “from the value of household and kitchen furniture to the ‘rise of the negroes from slavery to freedom in one generation.’” And they did so in a way that still looks “strikingly vibrant and modern, almost anticipating the crossing lines of Piet Mondrian or the intersecting shapes of Wassily Kandinsky.” However much their creators had explicitly modernist intentions, these designs also draw from historical techniques in data visualization—from 17th century scientific texts to Florence Nightingale’s revolutionary 19th century epidemiological maps.
You can view and download scans of all the hand-drawn Du Bois’ Pan-African Conference charts and graphs at the Library of Congress. There, you’ll also find other features of the Du Bois/Calloway/Washington Exhibit, including photographs of several African-American men who had “received appointment as clerks in civil service departments… through competitive examinations” and a “hand-lettered description of Hampton Normal and Agricultural Institute” in Virginia. Du Bois’ description of his project says as much about his sense of Black Nationalism as it does about pride in the progress made a generation after slavery: “an honest straightforward exhibit of a small nation of people, picturing their life and development without apology or gloss, and above all made by themselves.”
via Hyperallergic/All My Eyes/Seeing Complexity/Slate
Related Content:
Visualizing Slavery: The Map Abraham Lincoln Spent Hours Studying During the Civil War
The Art of Data Visualization: How to Tell Complex Stories Through Smart Design
Josh Jones is a writer and musician based in Durham, NC. Follow him at @jdmagness

Thank you for this wonderful piece of history. Completely interesting and useful on many levels. I am wondering if you know where the originals are of these charts? At the Smithsonian? And who might have the rights to these images? I would like to cite one in an article for an academic publication. If you can provide information for me, that would be excellent. JD
Hi Johanna, thanks for reading! I believe these are all at the Library of Congress and in the public domain. See all the digital scans with catalog information here: http://www.loc.gov/pictures/search/?q=%22lot%2011931%22%20NOT%20medal&st=grid&co=anedub&loclr=blogpic