The volume of data in our age is so vast that whole new research fields have blossomed to develop better and more efficient ways of presenting and organizing information. One such field is data visualization, which can be translated in plain English as visual representations of information.
The PBS “Off Book” series turned its attention to data visualization in a short video featuring Edward Tufte, a statistician and professor emeritus at Yale, along with three young designers on the frontiers of data visualization. Titled “The Art of Data Visualization,” the video does a good job of demonstrating how good design—from scientific visualization to pop infographics—is more important than ever.
In much the same way that Marshall McLuhan spoke about principles of communication, Tufte talks in the video about what makes for elegant and effective design. One of his main points: Look after truth and goodness, and beauty will look after herself.
What does Tufte mean by this? That design is only as good as the information at its core.
For those of us who aren’t designers, it’s refreshing to consider the elements of good visual story-telling. And that’s what the best design is, according to the experts in this video. Every data set, or big bunch of information, has its own core concept, just as every story has a main character. The designer’s job is to find the hero in the data and then tell the visual story.
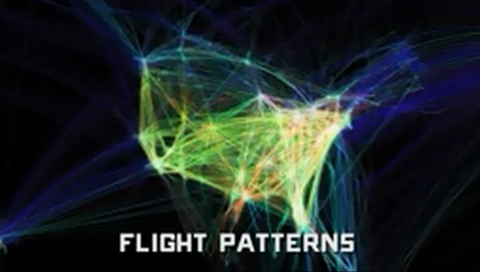
So much of the information we encounter every day is hard to conceptualize. It’s so big and complicated that a visual rendering represents it the best. That’s because human brains are wired to take in a lot of information at once. Good designers know that decision-making isn’t linear. It’s a super-fast process of recognizing patterns and making sense of them.
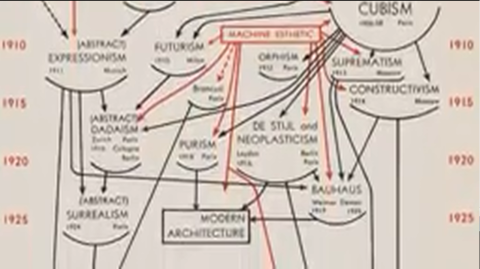
Information may be more abundant but it isn’t new, and neither is data visualization. In the video, Tufte talks about stone maps carved by early humans and how those ancient graphics form the template for Google maps.
What comes across in PBS’s video is that data visualization is an art, and the simpler the better. Tufte seems to argue that good data guides the designer to do good work, which leads to the question: Is the medium no longer, as McLuhan famously commented, the message?
Related Content:
An Animated Visualization of Every Observed Meteorite That Has Hit Earth Since 861 AD
Watch a Cool and Creepy Visualization of U.S. Births & Deaths in Real-Time
Kate Rix writes about digital media and education. Visit her website. Follow her on Twitter @mskaterix
Leave a Reply