Not a day goes by that I don’t use Google Maps for something or other, whether it’s basic navigation, researching an address, or finding a dry cleaner. Though some of us might resent the dominance such mapping technology has over our daily interactions, there’s no denying its endless utility. But maps can be so much more than useful tools for getting around—they are works of art, thought experiments, imaginative flights of fancy, and data visualization tools, to name but a few of their overlapping functions. For the imperialists of previous ages, maps displayed a mastery of the world, whether cataloguing travel times from London to everywhere else on the globe, or—as in the example we have here—resizing countries according to how much tea their people drank.
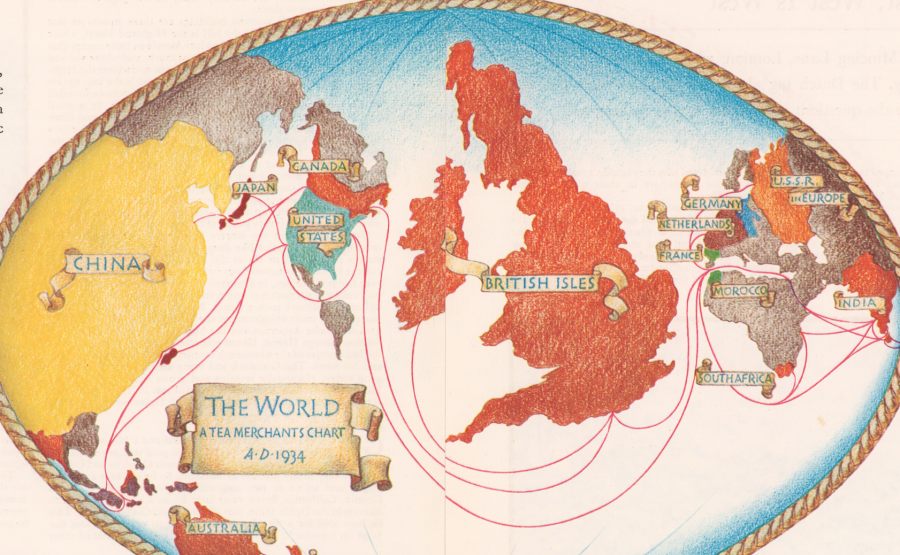
But this is not a map we should look to for accuracy. Like many such cartographic data charts, it promotes a particular agenda. “George Orwell once wrote that tea was one of the mainstays of civilization,” notes Jack Goodman at Atlas Obscura. “Tea, asserted Orwell, has the power to make one feel braver, wiser, and more optimistic. The man spoke for a nation.” (And he spoke to a nation in a 1946 Evening Standard essay, “A Nice Cup of Tea.”) From the map above, titled “The Tea is Drunk” and published by Fortune Magazine in 1934, we learn, writes Goodman, that “Britain consumed 485,000 pounds of tea per year. That’s one hundred billion cups of tea, or around six cups a day for each person.” We might note however, that “the population of China was then nine times bigger than that of the U.K., and they drank roughly twice as much tea as the Brits did.” Why isn’t China at the center of the map? “The author made a tenuous point about the cultural differences between the two: the Chinese drank tea as a necessity, the British by choice.”
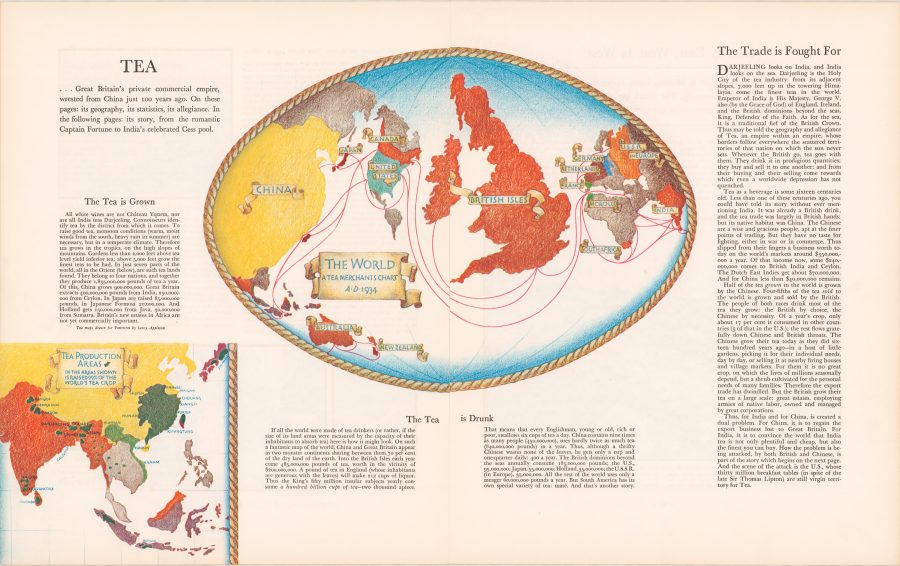
Cornell University library’s description of the map is more forthright: “While China actually consumed twice as much tea as Britain, its position at the edge of the map assured that the focus will be on the British Isles.” That focus is commercial in nature, meant to encourage and inform British tea merchants for whom tea was more than a beverage; it was one of the nation’s pre-eminent commodities, though most of what was sold as a national product was Indian tea grown in India. Yet the map brims with pride in the British tea trade. “Thus may be told the geography and allegiance of Tea,” its author proclaims, “an empire within an empire, whose borders follow everywhere the scattered territories of that nation on which the sun never sets.” A little over a decade later, India won its independence, and the empire began to fall apart. But the British never lost their taste for or their national pride in tea. View and download a high-resolution scan of the “Tea is Drunk” map at the Cornell Library site.
via Atlas Obscura
Related Content:
George Orwell Explains How to Make a Proper Cup of Tea
10 Golden Rules for Making the Perfect Cup of Tea (1941)
Josh Jones is a writer and musician based in Durham, NC. Follow him at @jdmagness
It’s astonishing now to understand that, in the absence of pervasive global “information,” this map would be regarded not as a distortion, not as an affront, not as “nationalist” atavism — but simply as a parochially amusing way to sell more tea while swelling the proud breast of the British Isles!
Just think of all the old stuff we never got a shot at deconstructing and discrediting back in the day when we had to think for ourselves. How *did* we get by?!
What about Turkey or other middle-eastern countries?!?!
Lorenzo is right — Turkey is totally missing from the map. Today Turkey is the world’s largest per capita consumer of tea, almost all of this grown domestically. Tea cultivation began in the late 19th century in Turkey as the British cracking of the millenia-long Chinese monopoly on the science of tea production allowed the spread of the tea bush to other climates friendly to it, such as the south-eastern coast of the Black Sea. In the turmoil following the collapse of the Ottoman empire and the rise of the Ataturkian state, tea consumption became an inextricable part of the Turkish psyche, relegating the more expensive, imported coffee of the Ottoman era to a luxury drink. Nowadays one cannot walk twenty meters in a Turkish town without running into a tea shop, nor take a meal (or even make it between meals!) without numerous cups of strong black tea, elegantly poured from a double teapot (effectively a mini-samovar) into exquisite hour-glass shaped, handleless transparent glasses over a cube of beet sugar. Apparently this map-maker, although apparently well versed in commerce, was utterly unaware of the rising tea culture at the other end of his continent — possibly because none of it would have been bought from Britain or sold in it.
I’m curious, Phil, as to how describing the map in exactly the same terms it uses to describe itself constitutes “thinking for yourself.”