On first encountering Antoni Jażwiński’s “Polish System,” I couldn’t help but think of Incan Quipu, the system that used knotted cords to keep official records. Like Quipu, Jażwiński’s system of colored squares relies on an extreme shorthand to tell complex stories with mnemonic devices. But maybe that’s where the similarities end. Jażwiński’s invention (circa (1820) does not so much resemble other forms of communication as it does the abstract art of the following century.
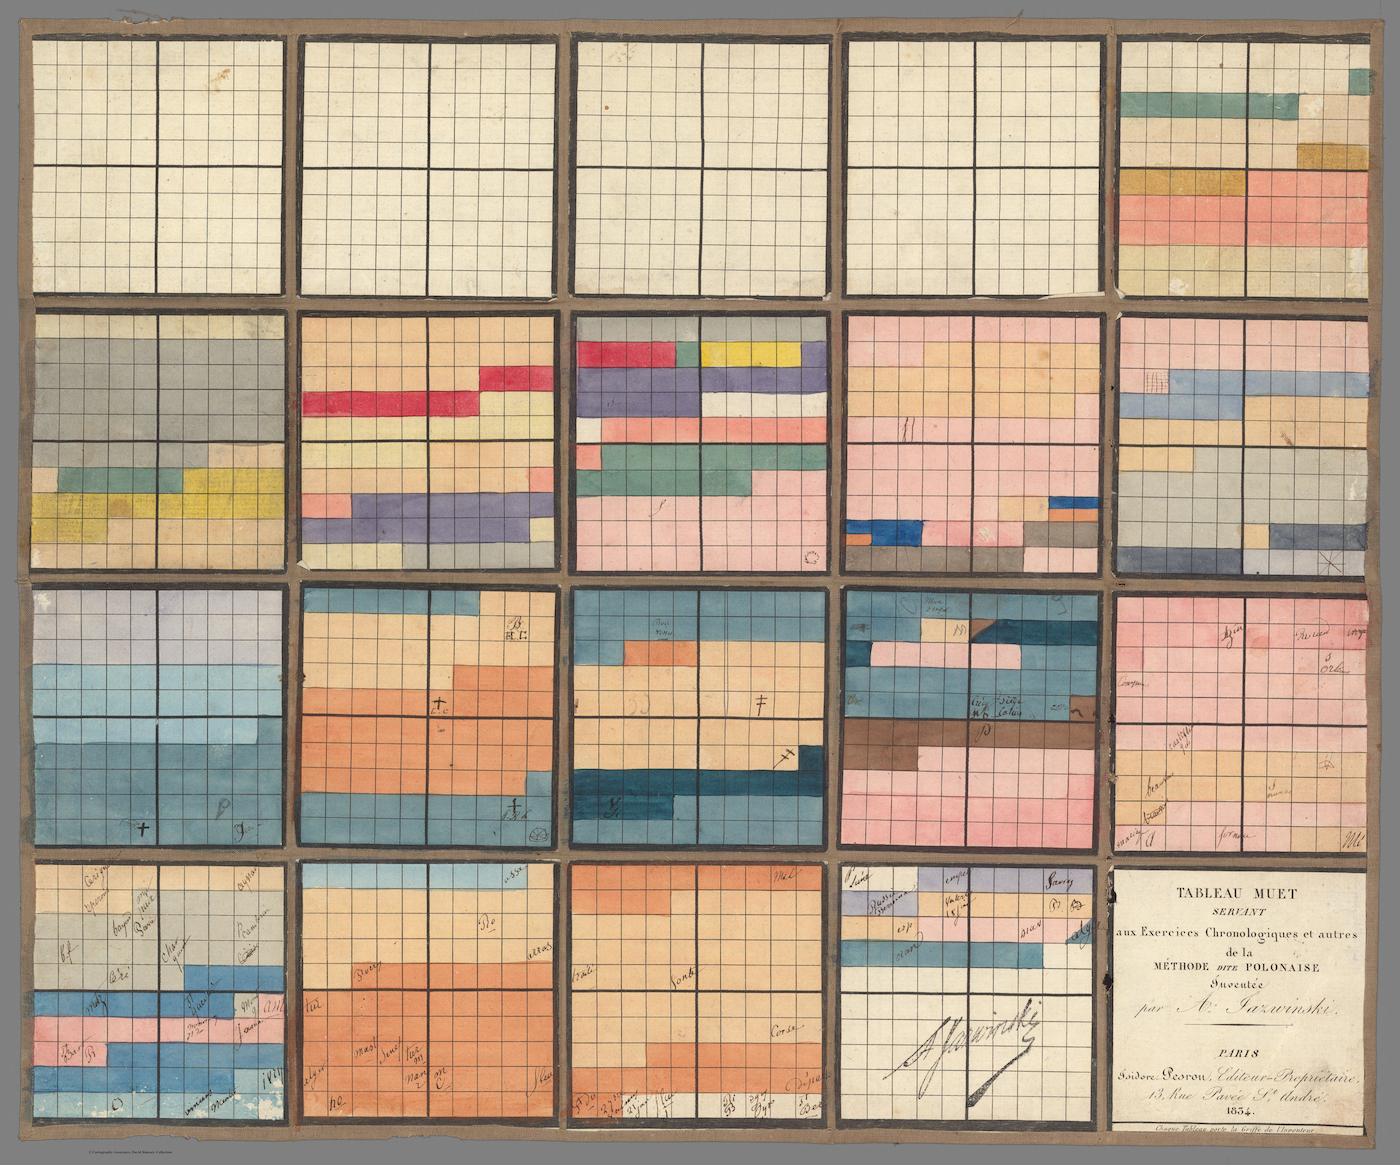
“Jażwiński’s Méthode polonaise promises that the complexities of centuries can be refined into colors, lines, squares, and just a few marks,” writes Philippa Pitts at Sequitur. “Neatly arranged into a diagram that can be diligently committed to memory, the twists and turns of battles and revolutions are rendered as panes of pure gentle color, quietly plotted as coordinates in a matrix, subsumed back into the orderly progress of history.”
His attempts to impose order on life may have come to little in the end, but as an artifact of visual culture, the “Polish System” is sublime. Pitts goes on to write:
There is a wonderful resonance between Jażwiński’s chronographs and a wide range of artistic production, despite the anachronism of such comparisons. They recall Piet Mondrian’s early checkerboards and Robert Delaunay’s simultaneity. There is something reminiscent of process art here: They evoke the repetitive, cataloguing handwork of Hanne Darboven or Agnes Martin. There appears to be a common calm, comfort, catharsis, or salvation promised by the embrace of rule, order, and logic.
Jażwiński, a Polish educator, invented the system in the 1820s. It was “later brought to public attention in the 1830s and 1840s by General Józef Bem, a military engineer with a penchant for mnemonics,” notes the Public Domain Review. Such systems cropped up everywhere in 19th-century education, such as those pioneered by Emma Willard, the first woman mapmaker in the U.S. “Jażwiński’s contribution (and its later adaptations) proved one of the most popular.”
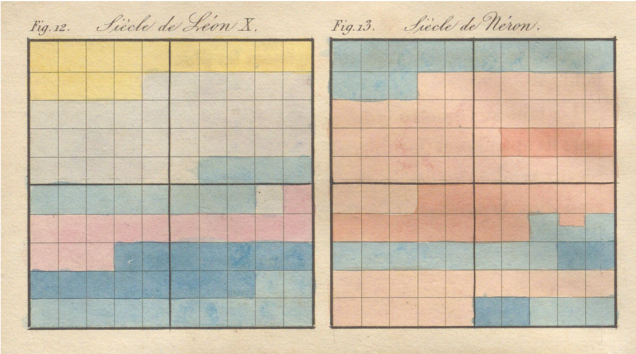
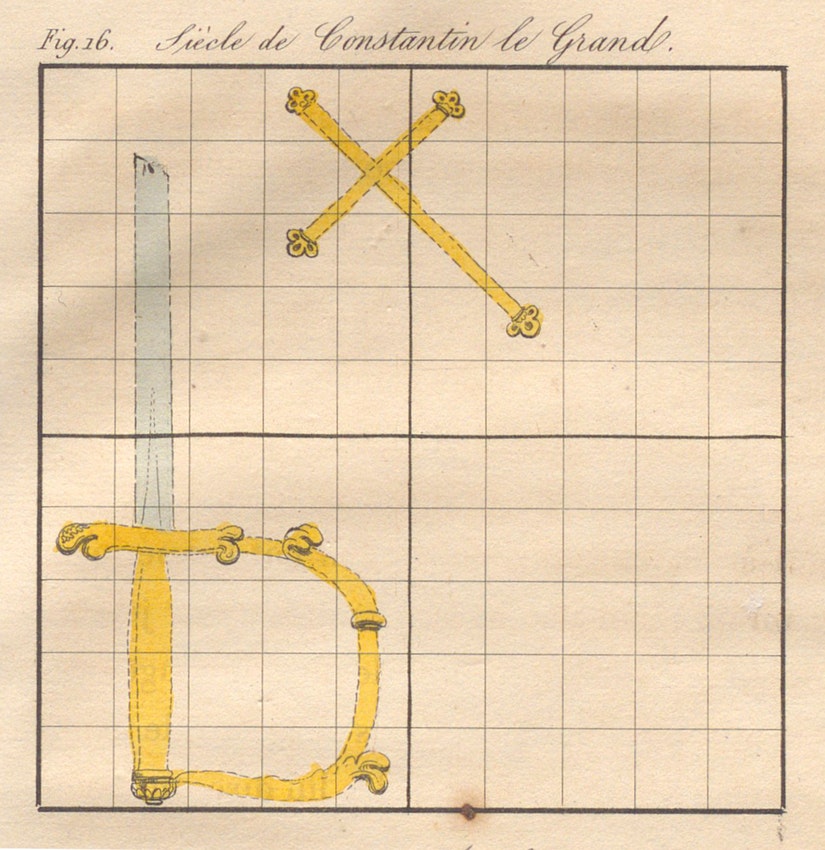
He explained his system with long paragraphs of text (which you can read here, in French), little of which students were likely to remember. What mattered was whether they could make sense of the color-coding and symbols placed inside the grid system, with each grid standing for an entire century — 100 years of human history reduced, for example, in the figure above, to one name, Constantine the Great, and two symbols, a sword and cross. This was an example of a “chronological constellation,” in which historical events take particular shapes, “sometimes it’s a chair,” Jażwiński wrote, “a sickle, a boat, a letter of the alphabet, etc.”
Even the names neatly printed above the grids are redundant, Pitts suggests. In such systems, called chronographs, “denotative text is of limited use. It is connotative visuality which further condenses the information: Flags, shields, and insignia can serve as shorthand for nations and dynasties, while looming storm clouds, bright sunbursts, and invocations of classical architecture add layers of associated meaning.” The view of history represented by such systems is quaint, at best; their oversimplifications erase more than they could ever communicate. But their visual appeal is undeniable as objects from a pre-Google past, when memorization was the only way to reliably store and access knowledge outside of books.
Related Content:
Josh Jones is a writer and musician based in Durham, NC. Follow him at @jdmagness
Leave a Reply