Every story has its architecture, its joints and crossbeams, ornaments and deep structure. The boundaries and scope of a story, its built environment, can determine the kind of story it is, tragedy, comedy, or otherwise. And every story also, it appears, generates a network—a web of weak and strong connections, hubs, and nodes.
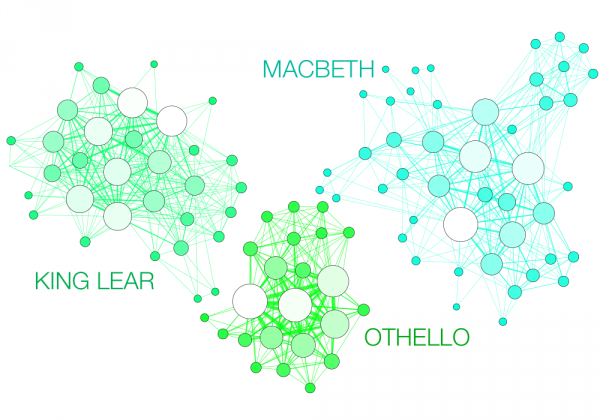
Take Shakespeare’s tragedies. We would expect their networks of characters to be dense, what with all those plays’ intrigues and feasts. And they are, according to digital humanities, data visualization, and network analysis scholar Martin Grandjean, who created the charts you see here: “network visualization[s] in which each character is represented by a node connected with the characters that appear in the same scenes.”
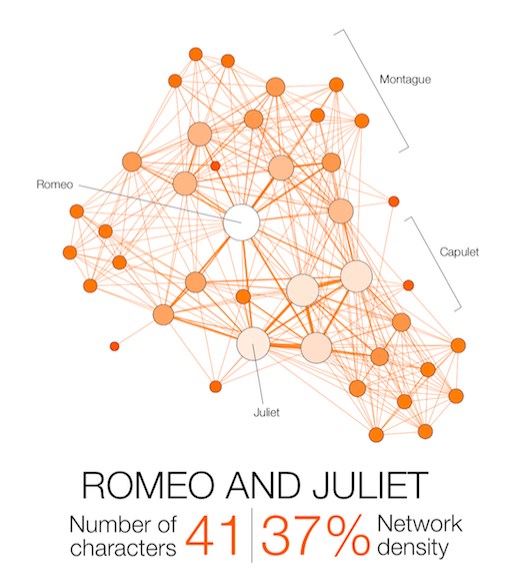
The result speaks for itself: the longest tragedy (Hamlet) is not the most structurally complex and is less dense than King Lear, Titus Andronicus or Othello. Some plays reveal clearly the groups that shape the drama: Montague and Capulets in Romeo and Juliet, Trojans and Greeks in Troilus and Cressida, the triumvirs parties and Egyptians in Antony and Cleopatra, the Volscians and the Romans in Coriolanus or the conspirators in Julius Caesar.
Grandjean’s visualizations show us how varied the density of these plays is. While Macbeth has 46 characters, it only achieves 25% network density. King Lear, with 33 characters, reaches 45%.
Hamlet’s density score nearly matches its number of characters, while Titus Andronicus’ density number exceeds its character number, as does that of Othello by over twice as much. Why is this? Grandjean doesn’t tell us. These data maps only provide an answer to the question of whether “Shakespeare’s tragedies” are “all structured in the same way.”
But does Grandjean’s “result speak for itself,” as he claims? Though he helps us visualize the way characters cluster around each other, most obviously in Romeo and Juliet, above, it’s not clear what a “density” score does for our understanding of the drama’s intent and purposes. With the exception of the most prominent few characters, the graphics only show various plays’ personae as nameless shaded circles, whereas Shakespeare’s skill was to turn most of those characters, even the most minor, into antitypes and anomalies. Perhaps as important as how they are connected is the question of who they are when they connect.
You can view and download a complete poster of all 11 of Shakespeare’s tragedies at Grandjean’s website.
Related Content:
Read All of Shakespeare’s Plays Free Online, Courtesy of the Folger Shakespeare Library
Josh Jones is a writer and musician based in Durham, NC. Follow him at @jdmagness
Thanks for new science of analysis