When we see stories pop up involving scientific findings in glacier ice, we might brace for unpleasant environmental news about the future. But a paper published just recently in Proceedings of the National Academy of Sciences instead reveals fascinating findings about the distant past—the history of ancient Rome between 1100 B.C.E. to 800 C.E. Historians know this 1,900-year period through archaeological and literary evidence. Now climate scientists have provided a treasury of new data to help substantiate or revise scholarly understandings of Rome’s economic rises and falls, by measuring the stratifications of lead pollution in a roughly 400-meter ice core from Greenland.
Why lead? “It’s a proxy for coin production,” says Seth Bernard, professor of ancient history at the University of Toronto. Roman currency, the denarius, was made from silver, mined primarily on the Iberian Peninsula. “But these mines didn’t excavate pure silver,” notes Robinson Meyer at The Atlantic. “Instead, they unearthed an ore of silver, lead, and copper that had to be smelted into silver. This process filled the air with lead pollution,” which eventually made its way on air currents to Greenland, where “storms deposited lead-tainted snow or sleet over the Arctic island.” New layers formed upon the old, each one preserved for posterity.
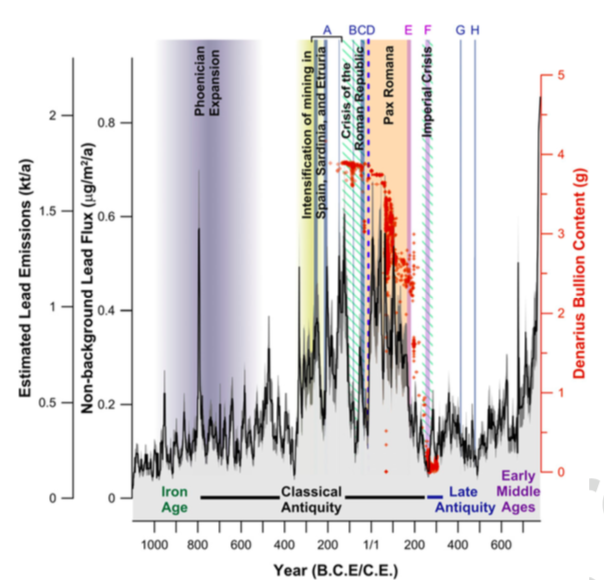
In the mid-1990s, scientists began drilling Greenland’s ice sheet in the North Greenland Ice core Project (NGRIP). At the time, a team attempted a similar analysis on the lead levels and their correspondence to ancient coinage, “which used a similar but rudimentary technique,” Meyer writes. But this study only drew from 18 data points. By contrast, the new research “made 25,000 different measurements of the ice core.” Improved technology has refined the measurement process, allowing researchers to detect “the presence of 35 different elements and chemicals at once,” and to tie their observations to specific years, or fairly close to it, anyway. The chart above shows the fluctuations in lead emissions over the almost 2000-year span.
One of the study’s authors, Joseph McConnell, estimates the margin of error as within one or two years. “That’s pretty good,” he says, “a lot better than what archaeologists are used to, I can tell you that.” This allows the team of climate scientists, archaeologists, and historians to match their observations about lead levels to known historical events. As The New York Times reports, “lead emissions rose in periods of peace and prosperity, such as the Pax Romana, which ran from 27 BC to 180 A.D. and dropped during the civil wars that preceded the Pax and the rise of the emperor Augustus. There were also dramatic drops that coincided with the Antonine plague of 165–180 A.D., thought to have been small pox, and the Cyprian plague, cause uncertain, of 250–270 A.D.”
The data, notes The Economist, “provide a new window onto the workings of the ancient economy…. Not all of the lead trapped in the glacier comes from silver minding, but much of it does,” and scientists can make informed guesses about just how much. Many unanswered questions remain. “What we’d love to have is a document that says Rome had a state monetary policy,” says Bernard. The empire’s specific economic policies are largely a mystery, but the ice core samples provide a wealth of new evidence for the increase and decrease in currency production, and ever-more refined technologies will allow for even more data to emerge from the pollutants trapped in glacial ice in the near future.
Related Content:
The Rise & Fall of the Romans: Every Year Shown in a Timelapse Map Animation (753 BC ‑1479 AD)
Josh Jones is a writer and musician based in Durham, NC. Follow him at @jdmagness
Leave a Reply