The Principles for Success by Entrepreneur & Investor Ray Dalio: A 30-Minute Animated Primer
Investor and hedge fund manager Ray Dalio has a net worth of $18.4 billion. That alone would persuade a great many of us to listen to any and all advice he has to offer, but unlike many multi-billionaires, he’s also put no small amount of thought into just what advice to give and how to give it. One reason is that the pieces of advice he doles out publicly began as pieces of advice for himself, discovered through trial and error and refined into a set of principles. These he lays out in his book Principles: Life and Work, the content of which he has also distilled into the animated video above, “Principles for Success by Ray Dalio.”
Dalio breaks down his own journey to success as the continued repetition of a five-step process:
- Know your goals and run after them
- Encounter the problems that stand in the way of getting to your goals
- Diagnose these problems to get at their root causes
- Design a plan to eliminate the problems
- Execute those designs
This framework already sets Dalio apart from other successful advice-givers, some of whom offer nothing more than broad platitudes about believing in yourself and never giving up hope, and others of whom fall back on cynical cracks about doing unto others before they do unto you. Dalio, for his part, endorses a mindset he calls “hyperrealism,” the adoption of which demands putting the truth before all else. And the hyperrealist first examines the truth about himself, assessing as objectively as possible his weaknesses as well as his strengths and regularly drawing upon the perspectives of those who disagree with him.
Underlying Dalio’s ideas about hyperrealism and success is a mechanistic conception of humanity, the economy, the world, indeed all reality: “Everything is a machine,” as he starkly puts it. By this, he doesn’t mean we should think of ourselves as pre-programmed robots, but that we can approach all of our choices as puzzles to be figured out. “Most everything happens over and over again in slightly different ways,” he says, but most of us, with our viewpoints biased toward recent history and our “ego and blind spot barriers” that keep us from seeing the full picture, mistakenly regard the situations in which we find ourselves as unique, thus making them into more difficult problems than they are.
Of course, even if we embrace hyperrealism and develop ever more reliable strategies to surmount the obstacles that crop up along our chosen paths, we’ll fail as often as we succeed. Dalio tells of his own grand humbling in the early 1980s when he bet everything on a depression that never came, and explains how the fallout taught him that “truth is the essential foundation for producing good outcomes.” Even if we have no interest in doing what it takes to make $18.4 billion, we might still bear in mind the two principle-driven equations that Dalio provides — “Dreams + reality + determination = a successful life” and “Pain + reflection = progress” — along with his conviction that success requires not just knowing the truth of world, but the truth of ourselves as well.
Related Content:
How The Economic Machine Works: A 30-Minute Animated Primer by Hedge Fund Investor Ray Dalio
Steve Jobs Shares a Secret for Success: Don’t Be Afraid to Ask for Help
Oprah Winfrey’s Harvard Commencement Speech: Failure is Just Part of Moving Through Life
Alain de Botton Proposes a Kinder, Gentler Philosophy of Success
Based in Seoul, Colin Marshall writes and broadcasts on cities, language, and culture. His projects include the book The Stateless City: a Walk through 21st-Century Los Angeles and the video series The City in Cinema. Follow him on Twitter at @colinmarshall, on Facebook, or on Instagram.
Read More...The 1855 Map That Revolutionized Disease Prevention & Data Visualization: Discover John Snow’s Broad Street Pump Map

No, he didn’t help defeat an implacable zombie army intent on wiping out all life. But English obstetrician John Snow seems as important as the similarly-named Game of Thrones hero for his role in persuading modern medicine of the germ theory of disease. During the 1854 outbreak of cholera in London, Snow convinced authorities and critics that the disease spread from a contaminated water pump on Broad Street, leading to the now-legendary infographic map above showing the incidences of cholera clustered around the pump.
Snow’s persistence resulted in the removal of the handle from the Broad Street pump and has been credited with ending an epidemic that claimed 500 lives. The Broad Street pump map has become “an enduring feature of the folklore of public health and epidemiology,” write the authors of an article published in The Lancet. They also point out that, contrary to popular retellings, the “map did not give rise to the insight” that the pump and its germ-covered handle caused the outbreak. “Rather it tended to confirm theories already held by the various investigators.”
Snow himself published a pamphlet in 1849 called “On the Mode of Communication of Cholera” in which he argued that “cholera is communicated by the evacuations from the alimentary canal.” As he reminded readers of The Edinburgh Medical Journal in an 1856 letter, in that same year, “Dr William Budd published a pamphlet ‘On Malignant Cholera’ in which he expressed views similar to my own.” Germ theory had a long, distinguished history already, and Snow and his contemporaries made sound, evidence-based arguments for it.
But their position “largely went ignored by the medical establishment,” notes Randy Alfred at Wired, “and was opposed by a local water company near one London outbreak.” The accepted, mainstream scientific opinion held that all disease was spread through “miasma,” or bad air. Pollution, it was thought, must be the cause. After the pump handle’s removal, Snow published an 1855 monograph on waterborne diseases. This was the first public appearance of the legendary map—after the removal of the handle.
Helping to inform Snow’s map, another investigator, parish priest Henry Whitehead had “concluded that it was the washing of soiled diapers into drains which flowed to the communal cesspool that contaminated the pump and started the outbreak,” writes Atlas Obscura. Whitehead, a former critic of germ theory, later pointed out that the removal of the pump handle didn’t actually stop the epidemic, which, he said, “had already run its course” by that point.
Nonetheless, Snow and other proponents of the theory were vindicated, Whitehead had to admit, and Snow’s intervention “had probably everything to do with preventing a new outbreak.” The simple, yet sophisticated data visualization would lead to radical new ways of conceptualizing disease outbreaks, helping to stop or prevent who knows how many epidemics before they killed hundreds or thousands. Snow’s map also deserves credit for giving “data journalists a model of how to work today.”
It was hardly the first or only data visualization of cholera outbreaks of the time. “As early as the 1830s,” Visual Capitalist points out, “geographers began using spacial analysis to study cholera epidemiology.” But Snow’s was by far the most influential, and effective, of them all. In his TED talk above, journalist Steven Johnson (author of The Ghost Map:The Story of London’s Most Terrifying Epidemic and How It Changed Science, Cities, and the Modern World) tells the story of how the outbreak, and Snow’s theory and map, “helped create the world that we live in today, and particularly the kind of city that we live in today.”
Read a Q&A with Johnson here; head over to The Guardian’s Data Blog to see Snow’s visualization recreated over a modern, satellite-view map of London and the Soho neighborhood of the famous Broad Street pump; and learn more about Snow and deadly cholera outbreaks in the crowded European cities of the early 19th century at the John Snow Archive and Research Companion online.
Related Content:
The Art of Data Visualization: How to Tell Complex Stories Through Smart Design
Josh Jones is a writer and musician based in Durham, NC. Follow him at @jdmagness
Read More...Why Should We Read Pioneering Sci-Fi Writer Octavia Butler? An Animated Video Makes the Case
Two of the most startlingly original science fiction writers of the past century, Samuel R. Delany and Octavia E. Butler, emerged in the 60s and 70s and created dystopian visions that resonate with us today with more depth and immediacy than the majority of their contemporaries. Both writers also happened to be African American. But why should this detail matter? Why indeed, asked Butler, in an equally relevant question, “is science fiction so white?” She went on to explore the question in a 1980 essay published in Transmission, not with a history of the genre, but with rebuttals to the reasons for excluding people like her.
“A more insidious problem than outright racism is simply habit, custom,” Butler writes. People get comfortable with things as they are—an attitude antithetical to the spirit of sci-fi. “Science fiction, more than any other genre deals with change—change in science and technology, and social change. But science fiction itself changes slowly, often under protest.”
Butler died too young, in 2006 at age 58; but she lived to see resistance to change in science fiction persist into the 21st century. Yet in her most compelling, and slightly terrifying, projection into the future—her mid-90s Parable series of novels—change is the only thing that anyone can rely on.
All that you touch, you Change. All that you Change Changes you.
N.K. Jemison quotes these lines from Parable of the Sower in her introduction to the book’s reissue this year. Published in 1993, Parable’s futurism didn’t have the same frisson as that of, say, William Gibson at the time. “Roving, uncontested gangs of pedophiles and drug-addicted pyromaniacs? Slavery 2.0? A powerful coalition of white-supremacist, homophobic, Christian zealots taking over the country?” writes Jemison. “Nah, I thought, and hoped Butler would get back to aliens soon.” Set in the context of a U.S. post-massive climate collapse (possibly), hyper-financialization, and corporate rule.… the novel now seems all too prescient to its current-day readers.
But even Butler’s alien stories are stories about humans in radical transition, and collective social actions with both devastating and transformative outcomes. In Dawn, the first novel in her Xenogenesis trilogy (now called “Lilith’s Brood”), human woman Lilith Iyapo “awakens after 250 years of stasis,” following an apocalyptic nuclear war on Earth, “to find herself surrounded by aliens called the Oankali,” as the animated TED-Ed lesson above by Ayana Jamieson and Moya Bailey tells it. These beings want to trade DNA with the remaining humans, thereby creating a hybrid species. The alternative is sterilization.
The chilling scenario in Dawn and its successors has its moments of Lovecraftian dread, but it goes in an even stranger direction, bringing an added dimension to the meaning of the word “dehumanization.” What would it mean to slowly transform into another species? Such profoundly universal questions about the meaning of human identity reached “readers who had been excluded from the genre,” notes Emanuella Grinberg at CNN. Butler peoples her books with humans of every color and ethnicity, and aliens only she might have imagined. But most of her protagonists are black and brown women. Many of the readers Butler influenced, like Jemison, are women of color who became genre-changing sci-fi writers themselves.
Butler’s work “helped define the literary cornerstone of Afrofuturism,” notes Grinberg. Her writing was strategic, a way to confront dehumanizing political and social political realities. Parable of the Sower, the TED lesson explains, was partly a response to Butler’s home state of California’s Proposition 187, which denied undocumented immigrants basic healthcare, education, and basic services. In the follow-up, Parable of the Talents (1998), an authoritarian presidential candidate campaigns on the slogan “Make American Great Again.” Her best-selling novel, Kindred, published in 1979, tells the story of a contemporary woman repeatedly pulled back in time to the Maryland plantation of her enslaved ancestor.
Why should we read Octavia Butler? You’ll have to read her to answer that question yourself. But I’d venture to say—along with the intro to her life and work above—because she had a better read on how the time she lived in would turn into the time we live in now than nearly anyone writing at the time; because she told strange, wonderful, outlandish, compelling stories that stretched the imagination without losing sight of the human core; because, like Ursula K. Le Guin, she challenged the world as it is with profound visions of what it might be; and because she not only excelled as a storyteller but specifically as a committed science fiction storyteller, one who deeply touched, and thus deeply changed, the form.
Related Content:
Josh Jones is a writer and musician based in Durham, NC. Follow him at @jdmagness
Read More...George Herriman’s Krazy Kat, Praised as the Greatest Comic Strip of All Time, Gets Digitized as Early Installments Enter the Public Domain
“As a cartoonist, I read Krazy Kat with awe and wonder,” writes Calvin and Hobbes creator Bill Watterson in his introduction to The Komplete Kolor Krazy Kat. The creator of quite possibly the most beloved comic strip of the past thirty years calls Krazy Kat “such a pure and completely realized personal vision that the strip’s inner mechanism is ultimately as unknowable as George Herriman,” the artist who wrote and drew it for its entire three-decade run from 1913 to 1944. “I marvel at how this fanciful world could be so forcefully imagined and brought to paper with such immediacy. THIS is how good a comic strip can be.”

High praise, especially from the hyperbole-resistant Watterson, a sharp-eyed critic of his art form and perceiver of its unrealized potential. “Quirky, individual, and uncompromised, Krazy Kat is one of the very few comic strips that takes full advantage of its medium. There are some things a comic strip can do that no other medium, not even animation, can touch, and Krazy Kat is a virtual essay on comic strip essence.”
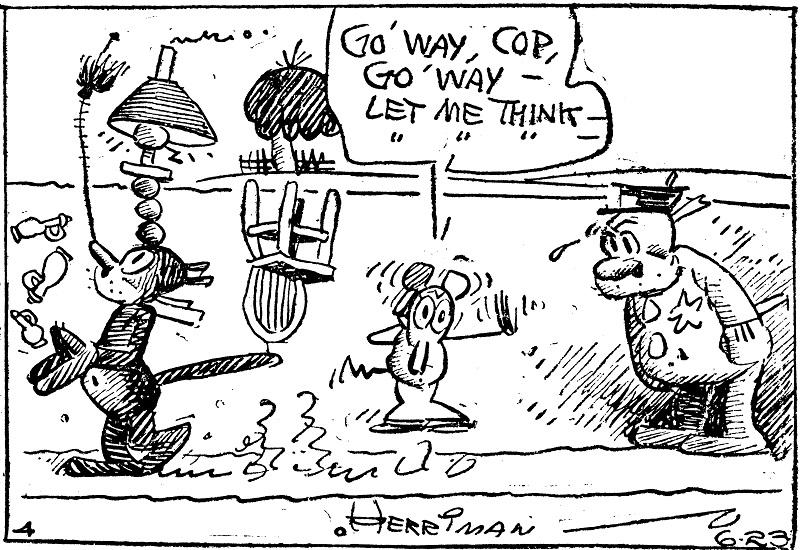
The “self-consciously baroque narrations and monologues” show that “words can be funny in themselves”; “the sky turns from black to white to zigzags and plaids simply because, in a comic strip, it CAN”; its surreal Arizona desert setting “is a character in the story, and the strip is ‘about’ that landscape as much as it is about the animals who populate it,” Ignatz Mouse, Offissa Pupp, and the titular Krazy Kat.
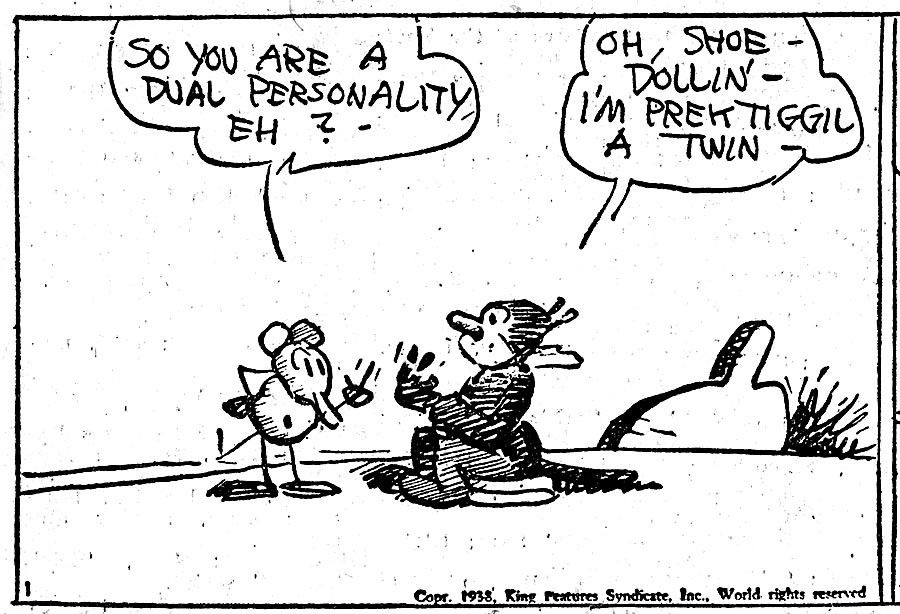
Ignatz Mouse “demonstrates his contempt for Krazy by throwing bricks at her” (though their genders, so modern observers note, were never quite stable), “Krazy reinterprets the bricks as signs of love,” and Offissa Pupp, the desert’s lone lawman, is “obliged by duty (and regard for Krazy) to thwart and punish Ignatz’s ‘sin,’ thereby interfering with a process that’s satisfying to everyone for all the wrong reasons.”
Now readers everywhere can feel that satisfaction for themselves at the web site of Krazy Kat fan Joel Franusic, who has launched a project to find and digitize (using Machine Learning) all of Herriman’s strips that have so far fallen into the public domain. Franusic writes of having got into Krazy Kat in the first place because of the presence of Calvin and Hobbes in his childhood: “I remembered how Bill Watterson referenced Krazy Kat as a big reason why he insisted on getting a larger full color format for his Sunday comic strips.”
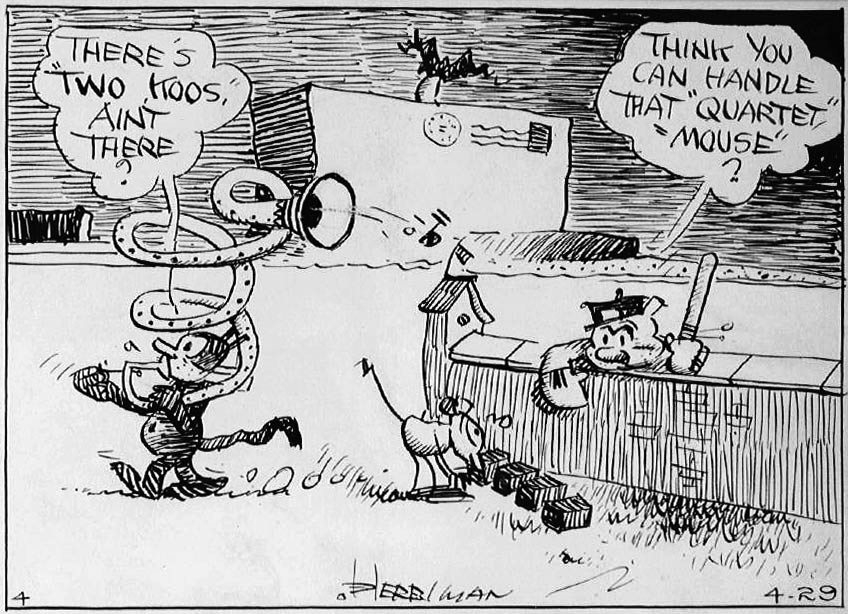
I myself first picked up a Krazy Kat collection as a Calvin and Hobbes-loving elementary schooler, and soon found myself captivated by the sheer density of strangeness in its pages. But read enough of Herriman’s masterwork, and that strangeness takes on a strong meaning that nevertheless differs from reader to reader. “Krazy Kat has been described as a parable of love, a metaphor for democracy, a ‘surrealistic’ poem, unfolding over years and years,” writes Chris Ware, another of the most respected comic-strip artists alive. “It is all of these, but so much more: it is a portrait of America, a self-portrait of Herriman, and, I believe, the first attempt to paint the full range of human consciousness in the language of the comic strip.” And now, 75 years after its conclusion, much more of humanity can enjoy Krazy Kat than ever. Explore digitized scans at Franusic’s web site. Or pick up a copy of the new edition of The Complete Krazy Kat in Color, a color facsimile of the complete pages of Krazy Kat 1935–44.
via BoingBoing
Related Content:
Umberto Eco Explains the Poetic Power of Charles Schulz’s Peanuts
Download 15,000+ Free Golden Age Comics from the Digital Comic Museum
Download Over 22,000 Golden & Silver Age Comic Books from the Comic Book Plus Archive
Based in Seoul, Colin Marshall writes and broadcasts on cities, language, and culture. His projects include the book The Stateless City: a Walk through 21st-Century Los Angeles and the video series The City in Cinema. Follow him on Twitter at @colinmarshall, on Facebook, or on Instagram.
Read More...An Illustrated Version of The Mueller Report: Read Online an Edition Created by the Author of Black Hawk Down and an Illustrator from Archer

The 448 page Mueller Report doesn’t make for breezy beach reading. That’s for sure. But, “buried within the Mueller report, there is a narrative that reads in parts like a thriller.” Working with that theory, Insider.com “hired Mark Bowden, a journalist and author known for his brilliant works of narrative nonfiction like Black Hawk Down, Killing Pablo, and Hue 1968.” And they gave him an assignment: “Use the interviews and facts laid out in the Mueller Report (plus those from reliable, fact-checked sources and published firsthand accounts)” and create an account that’s “so gripping it will hold your attention (and maybe your congressional representative’s).” They also hired “Chad Hurd, an illustrator from the art department of Archer,” and “asked him to draw out scenes from the report to bring them to life.” Find the resulting illustrated edition of The Mueller Report right here.
If you would like to support the mission of Open Culture, consider making a donation to our site. It’s hard to rely 100% on ads, and your contributions will help us continue providing the best free cultural and educational materials to learners everywhere. You can contribute through PayPal, Patreon, and Venmo (@openculture). Thanks!
Related Content:
Read More...A Beautiful 1870 Visualization of the Hallucinations That Come Before a Migraine
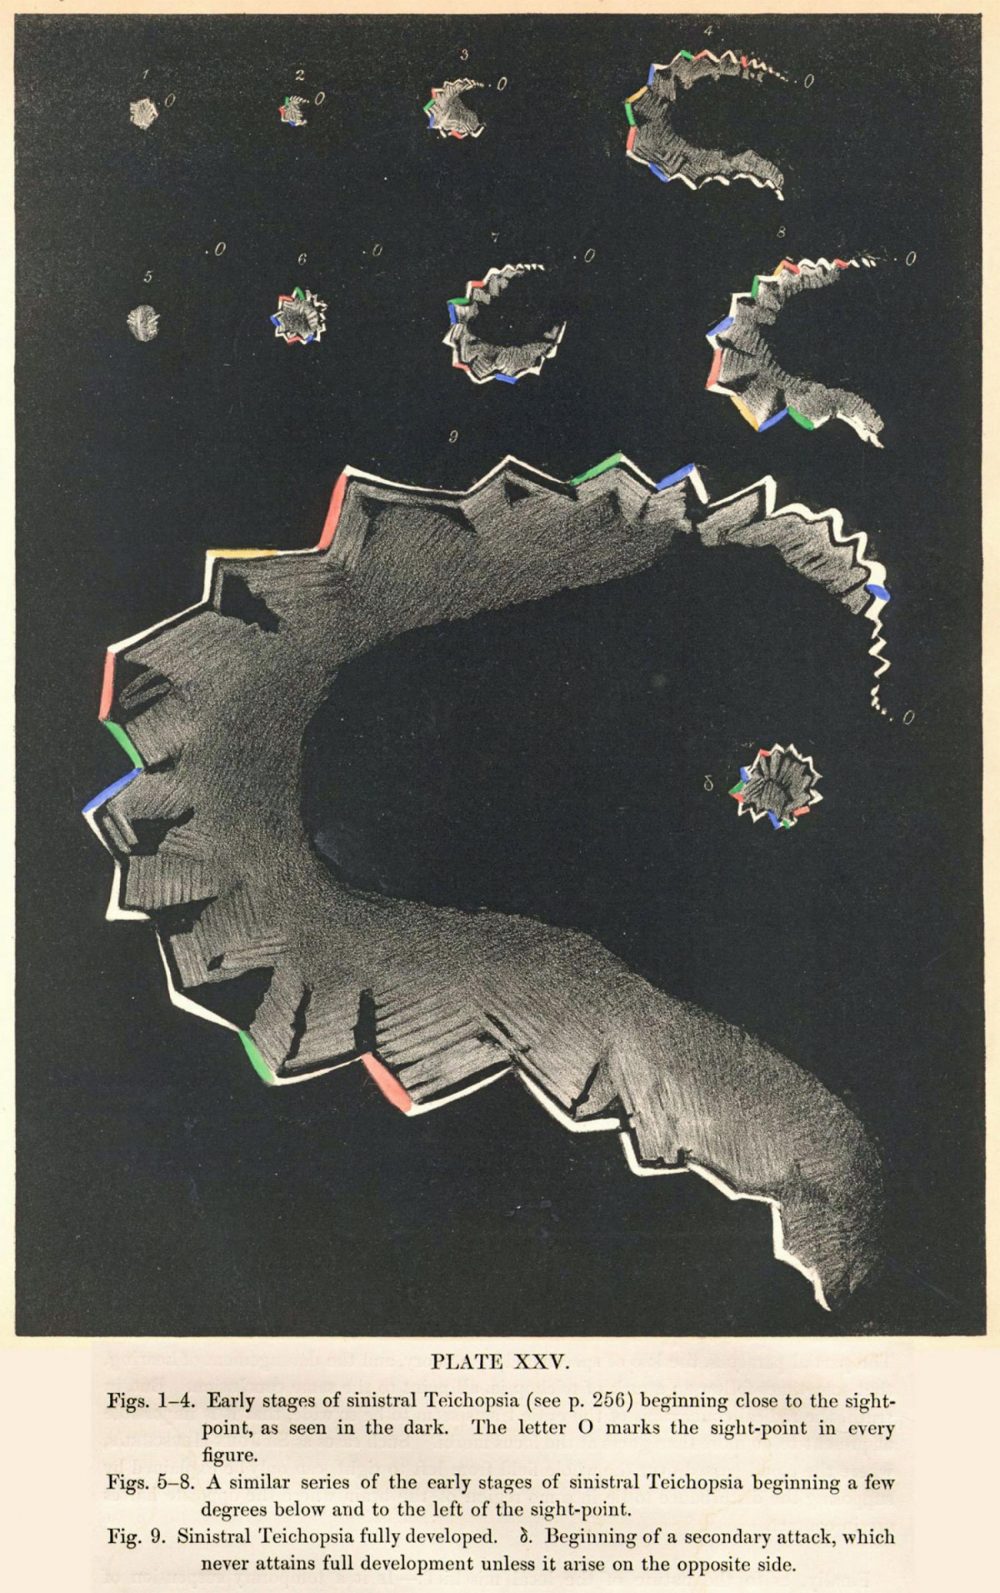
Headaches number among humanity’s most common ailments. The headache-related disorders known as migraines may be rarer, afflicting roughly fifteen percent of the population, but they’re also much more severe. Besides a headache that can last as long as three days, migraines can also come with various other symptoms including nausea as well as sensitivity to light, sound, and smells. They even cause some sufferers to hallucinate: the visual elements of these pre-migraine “auras” might take the shape of distortions, vibrations, zig-zag lines, bright lights, blobs, or blind spots. Sometimes they also come in color, and brilliant color at that.
Those colors jump right out of this 1870 drawing by English physician Hubert Airy, with which he sought to capture his own visual experience of a migraine. He “first became aware of his affliction in the fall of 1854,” writes National Geographic’s Greg Miller, “when he noticed a small blind spot interfering with his ability to read. ‘At first it looked just like the spot which you see after having looked at the sun or some bright object,’ he later wrote. But the blind spot was growing, its edges taking on a zigzag shape that reminded Airy of the bastions of a fortified medieval town.” As Airy describes it, “All the interior of the fortification, so to speak, was boiling and rolling about in a most wonderful manner as if it was some thick liquid all alive.”
To a migraneur, that description may sound familiar, and the drawing that accompanied it in the Philosophical Transactions of the Royal Society in 1870 may look even more so. Called “arguably the most beautiful scientific records of migraine aura ever made” by G.D. Schott in Brain, Airy’s drawings “record the progress and expansion of his own visual disturbances” over their half-hour-long onset. Apart from their stark beauty, writes Miller, the set of drawings “anticipates discoveries in neuroscience that were still decades in the future,” such as the assumption that the hallucinations originate in the brain rather than the eyes and that certain parts of the field of vision correspond to certain parts of the visual cortex.
“There’s still much we don’t know about migraines and migraine auras,” Miller writes. “One hypothesis is that a sort of electrical wave sweeps across the visual cortex, causing hallucinations that spread across the corresponding parts of the visual field” — an idea with which Airy’s early renderings also accord. And what about the source of all those colors? Electrical waves passing through parts of the brain “that contain neurons that respond to specific colors” may be responsible, but nearly 150 years after the publication of Airy’s drawings, “no one really knows.” Migraine research of the kind pioneered by Airy himself may have dispelled some of the mystery surrounding the affliction, but a great deal nevertheless remains. Airy’s drawings, still among the most vivid representations of the visual aspect of migraines ever created, will no doubt inspire generations of future neuroscientists to find out more.
via Greg Miller at National Geographic and don’t miss his book: All Over the Map: A Cartographic Odyssey.
Related Content:
Hunter S. Thompson’s Personal Hangover Cure (and the Real Science of Hangovers)
Free Guided Imagery Recordings Help Kids Cope with Pain, Stress & Anxiety
Based in Seoul, Colin Marshall writes and broadcasts on cities, language, and culture. His projects include the book The Stateless City: a Walk through 21st-Century Los Angeles and the video series The City in Cinema. Follow him on Twitter at @colinmarshall, on Facebook, or on Instagram.
Read More...The Evolution of the World Map: An Inventive Infographic Shows How Our Picture of the World Changed Over 1,800 Years
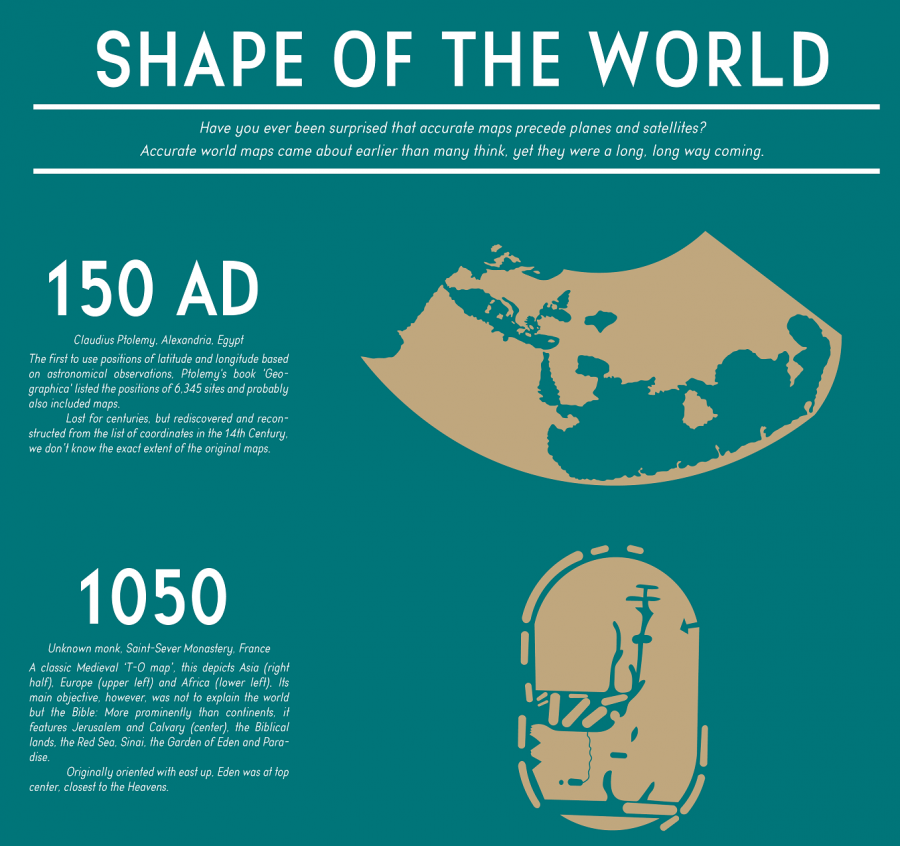
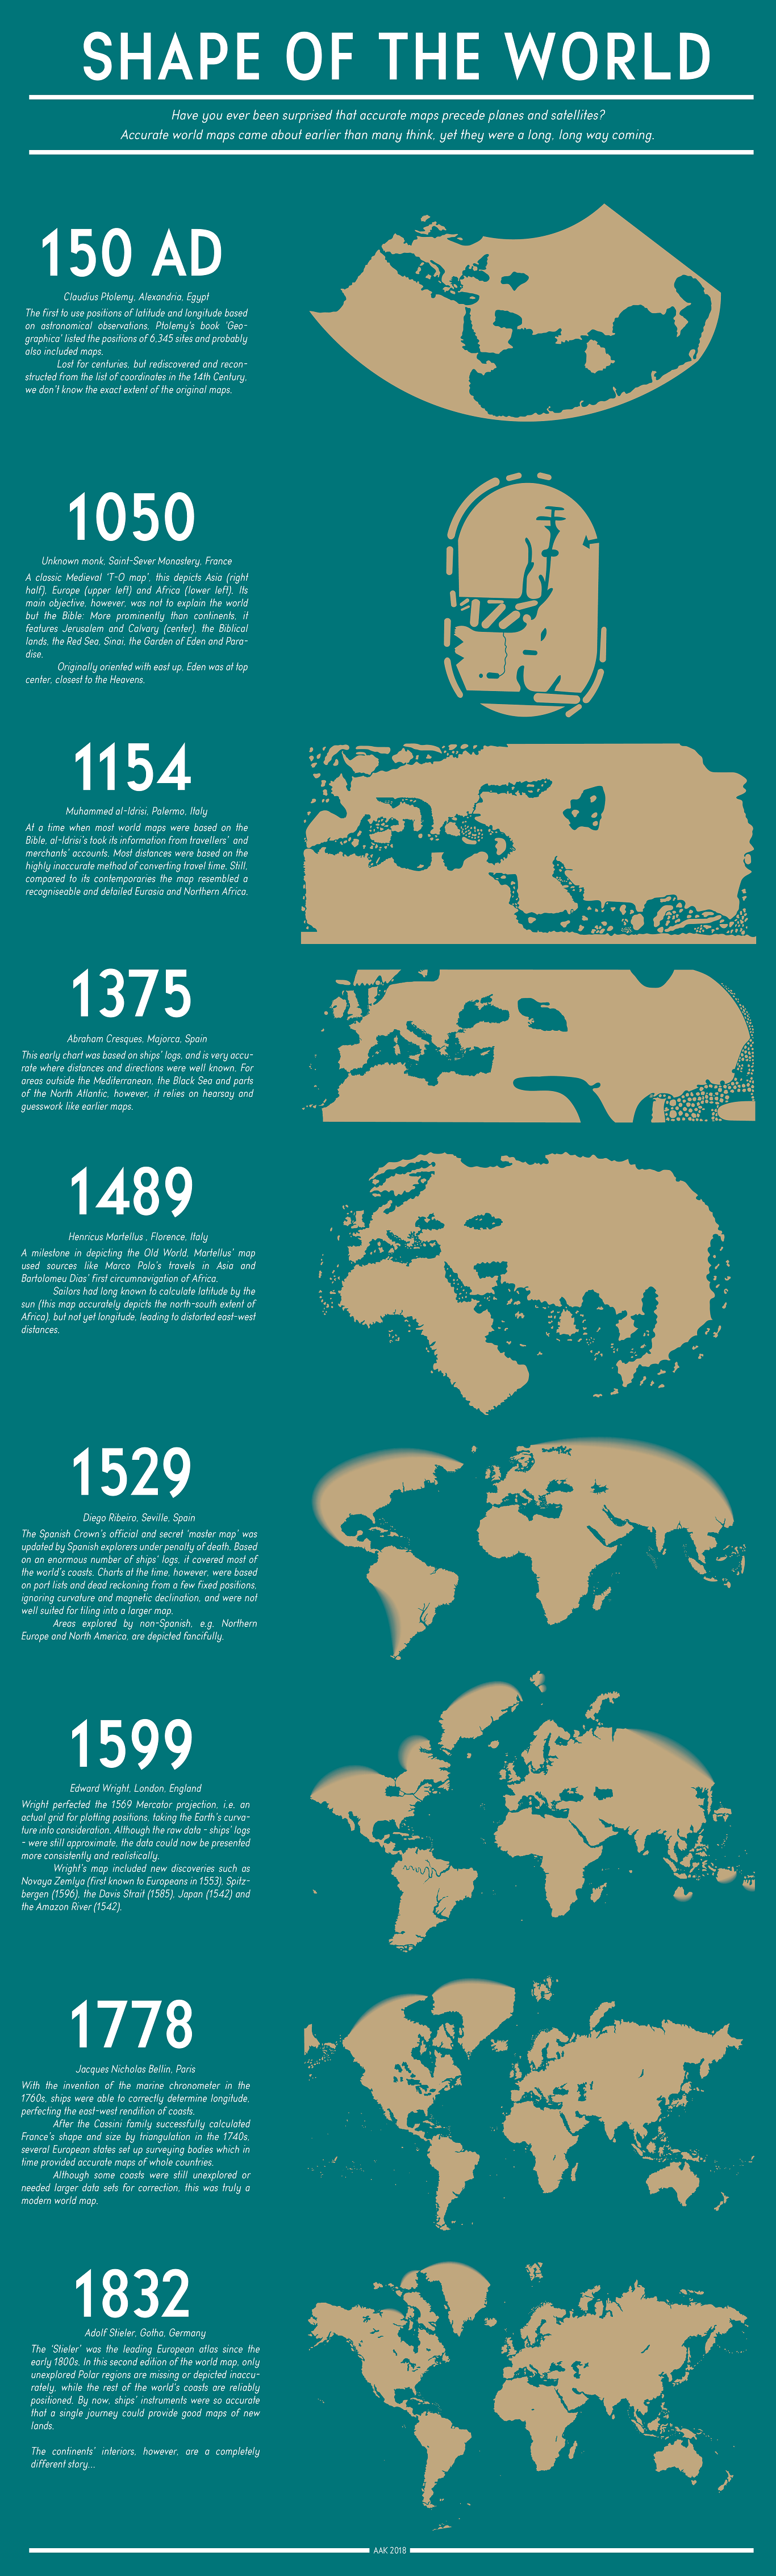
For about 190 years, humanity has known what the world looks like. Or rather, humanity has known the shape and size of the land masses that rise up above the oceans, as well as where those land masses stand in relation to one another. For generation upon generation, we’ve all grown up seeing visual depictions of this knowledge in the form of the standard world map — distorted, of course, usually by Mercator projection, given the impossibility of turning a three-dimensional globe into a two-dimensional image with perfect accuracy. We can call it to mind (or up on our phones) whenever we need it. But what did the world look like before we knew what it looked like? Thanks to a Redditor who goes by PisseGuri82, we can now take in, at a glance, humanity’s image of the world as it evolved over the past two millennia.
This Shape of the World infographic begins in 150 AD with the world map used by Claudius Ptolemy of Alexandria, Egypt, “the first to use positions of latitude and longitude based on astronomical observations.” Not that those observations produced anything immediately resembling an ancestor of the map we remember from classroom walls growing up, but it certainly must have marked an improvement on the guesswork and pure fantasy used in even earlier times.
World maps from the medieval period, such as the one included on the diagram created by an unknown French monk in 1050, were meant “not to explain the world but the Bible.” Hence its focus on such Biblical parts of the world as Jerusalem, the Red Sea, and even the Garden of Eden.
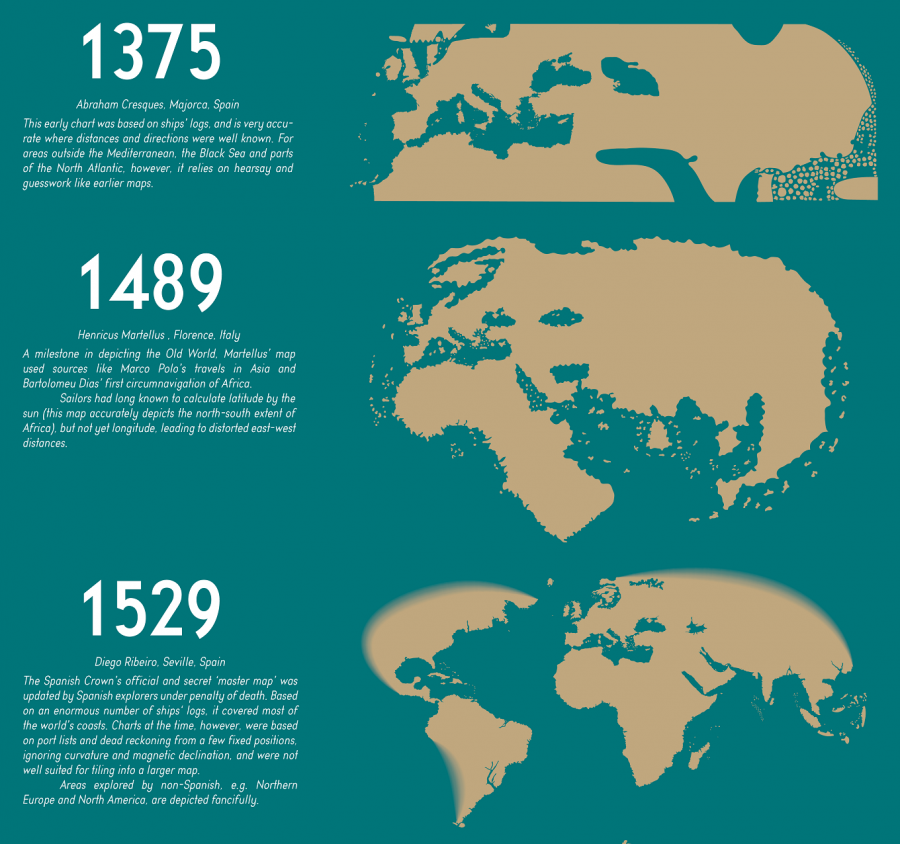
Just over a century later, a map by Italy’s Muhammed al-Idrisi employed the more objective method of calculating distances by what travelers and merchants told him about how long it took them to reach the distant lands they visited. Despite its “recognizable and detailed Eurasia and Northern Africa,” however, it still makes for a vague (and, needless to say, hardly complete) approximation of the world. Only in 1529, with the empire-minded Spanish Crown’s official and secret “master map,” updated “by Spanish explorers on pain of death,” do we arrive at a world map that would remind any of us of the ones we use in the 21st century.
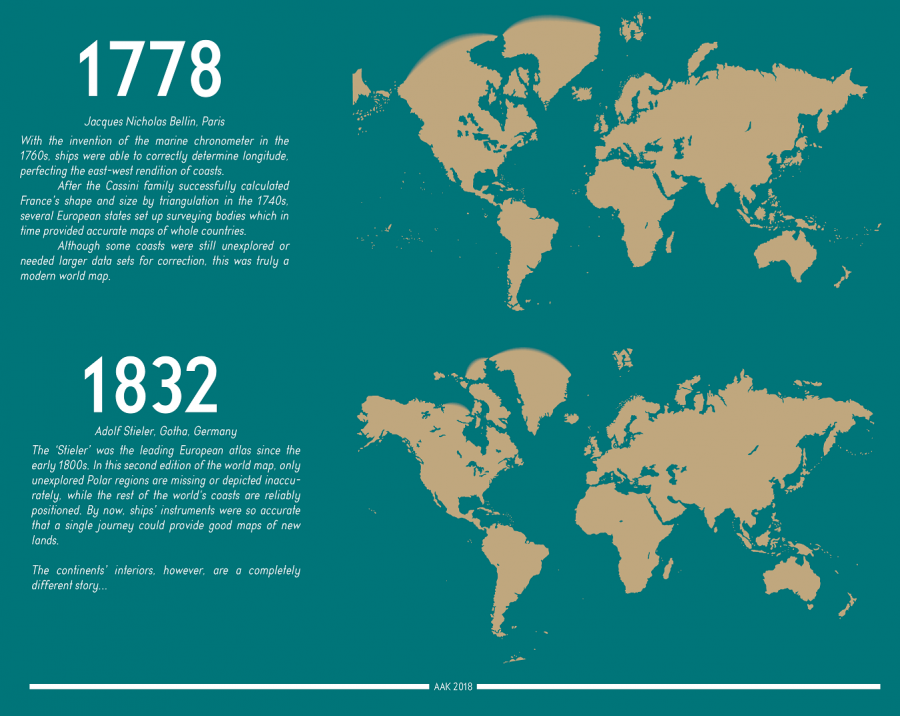
Subsequent developments came from such advances as the aforementioned Mercator projection, invented in 1569 in the Netherlands and refined in England 30 years later, as well as the invention of the marine chronometer in 1778. The final map in the chart, an 1832 edition by Germany’s Adolf Stieler in which “only the unexplored Polar regions are missing or depicted inaccurately,” may look almost exactly like the world maps we use today. But the evolution certainly hasn’t stopped: with the ever more detailed digital maps and satellite imagery that now feature in our world maps, our ability to perceive the Earth still improves every day. Our descendants 2000 years hence may well place themselves in a world we would hardly recognize. See the full-size “Shape of the World” infographic here. Make sure you click on the image once you open the page, and then you can see it in a larger format.
Related Content:
Japanese Designers May Have Created the Most Accurate Map of Our World: See the AuthaGraph
The History of Cartography, the “Most Ambitious Overview of Map Making Ever,” Now Free Online
A Radical Map Puts the Oceans – Not Land – at the Center of Planet Earth (1942)
Why Making Accurate World Maps Is Mathematically Impossible
Based in Seoul, Colin Marshall writes and broadcasts on cities, language, and culture. His projects include the book The Stateless City: a Walk through 21st-Century Los Angeles and the video series The City in Cinema. Follow him on Twitter at @colinmarshall, on Facebook, or on Instagram.
Read More...Napoleon’s Disastrous Invasion of Russia Detailed in an 1869 Data Visualization: It’s Been Called “the Best Statistical Graphic Ever Drawn”
It’s tempting to associate data visualizations with PowerPoint and online graphics, which have enabled an unheard-of capacity for disseminating full-color images. But the form reaches much further back in history. Further back, even, than the front pages of USA Today and glossy sidebars of Time and
Newsweek. In 1900, for example, W.E.B. Du Bois made impressive use of several full-color data visualizations for the First Pan-African Conference in London, with no access whatsoever to desktop publishing software or a laser printer.
Almost fifty years before Du Bois turned statistics into swirls of color and shape, Florence Nightingale used her little-known graphic design skills to illustrate the causes of disease in the Crimean War and John Snow (not Jon Snow) illustrated his revolutionary Broad Street Pump cholera theory with a famous infographic street map.
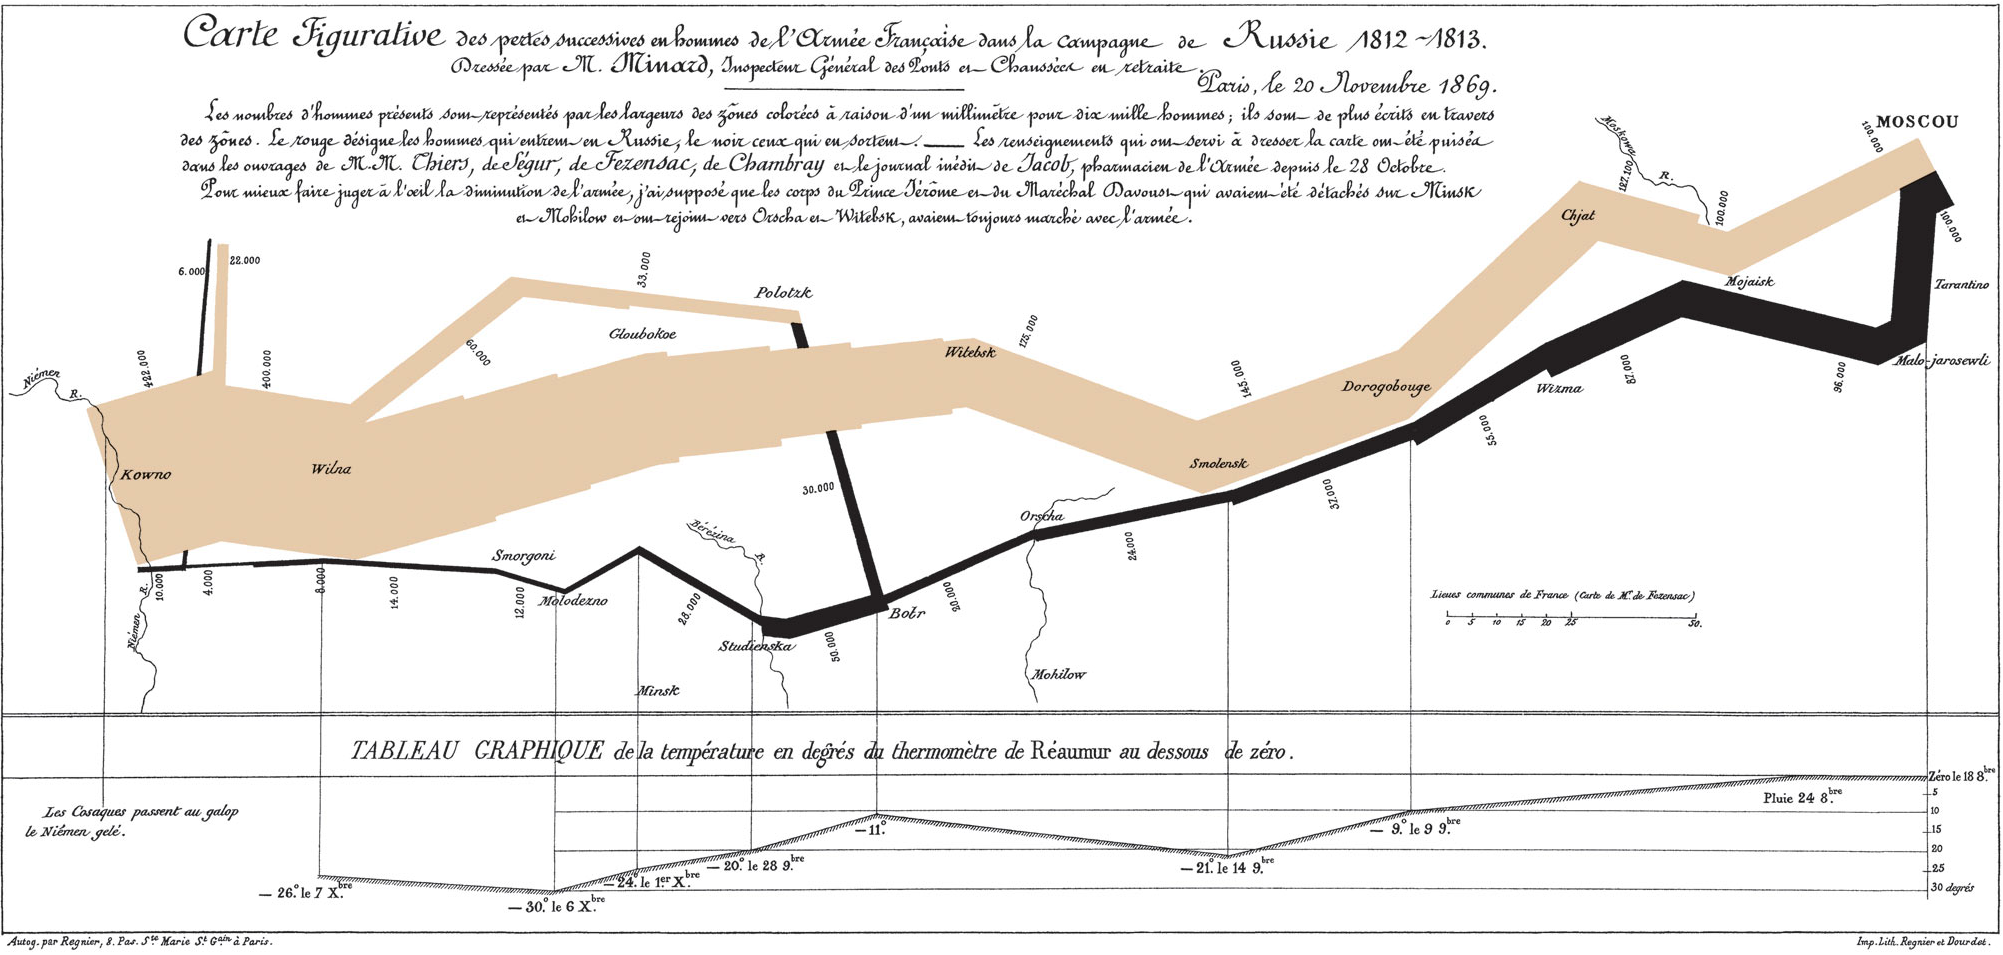
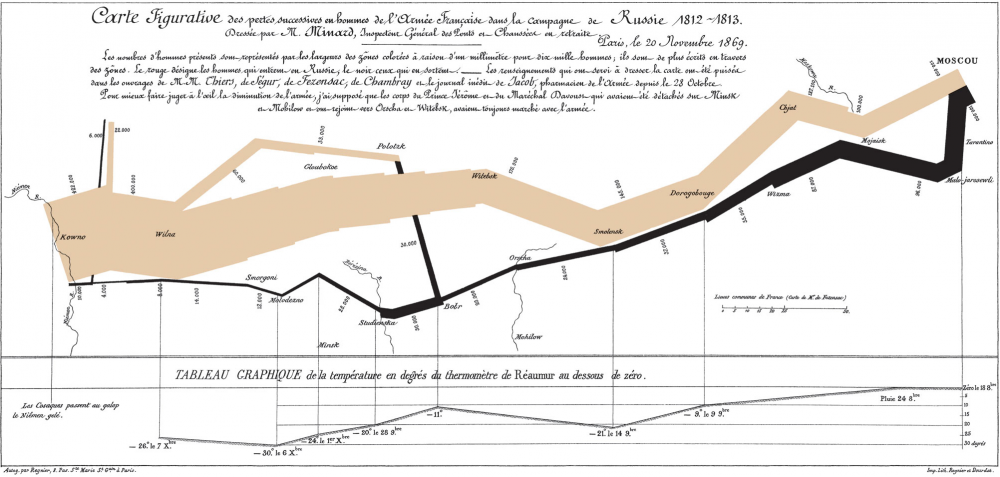
Around this same time, another data visualization pioneer, Charles Joseph Minard, produced some of the most highly-regarded infographics ever made, including the 1869 illustration above of Napoleon’s march to, and retreat from, Moscow in the War of 1812. View it in a large format here.
Made fifty years after the event, when Minard was 80 years old, the map has been called by the bible of data visualization studies—Edward Tufte’s The Visual Display of Quantitative Information—“probably the best statistical graphic ever drawn.” Over at thoughtbot.com, Joanne Cheng sums up the context, if you needed a historical refresher: “The year is 1812 and Napoleon is doing pretty well for himself. He has most of Europe under his control, except for the UK.”
Angered by Czar Alexander’s refusal to support a UK trade embargo to weaken their defenses, Napoleon “gathers a massive army of over 400,000 to attack Russia.” The campaign was disastrous: overconfident advances on Moscow turned into devastating wintertime retreats during which the Grande Armée only “narrowly escaped complete annihilation.” So, how does Minard’s 1869 Tableau Graphique tell this grand story of hubris and icy carnage? And, Cheng asks, “what makes it so good?”
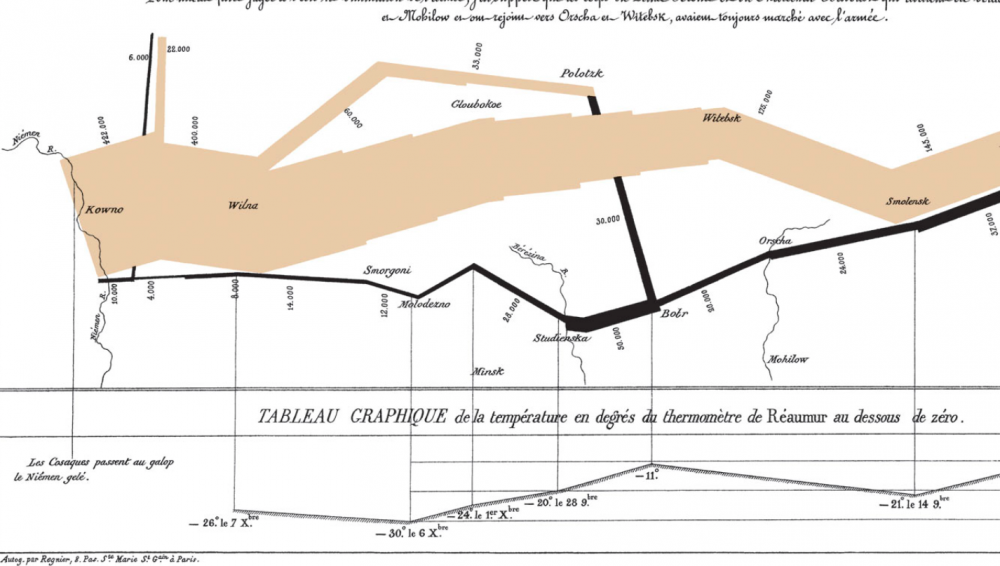
Cheng breaks Minard’s series of jagged lines and shapes down into more conventional XY axis line graphs to show how he coordinated a huge amount of information, including the locations (by longitude) of different groups of Napoleon’s troops at different points in time, their direction, and the precipitously falling temperatures in the stages of retreat. He drew from a list of the best historical sources he could consult at the time, turning dense prose into the spare, clean lines that set data scientists’ hearts a‑flutter.
Minard began his career in a much more recognizably 19-century design field, building bridges, dams, and canals across Europe for the first few decades of the 1800s. As a civil engineer “he had the good fortune to take part in almost all the great questions of public works which ushered in our century,” noted an obituary published in Annals of Bridges and Roads the year after Minard’s death in 1870. “And during the twenty years of retirement, always au courant of the technical and economic sciences, he endeavored to popularize the most salient results.”
He did so by venturing outside the subject of engineering, while using the “innovative techniques he had invented for the purpose of displaying flows of people” on paper, writes Michael Sandberg at DataViz. In order to tell the tragic tale” of Napoleon’s crushing defeat “in a single image,” Minard imagined the event as a dynamic physical structure.
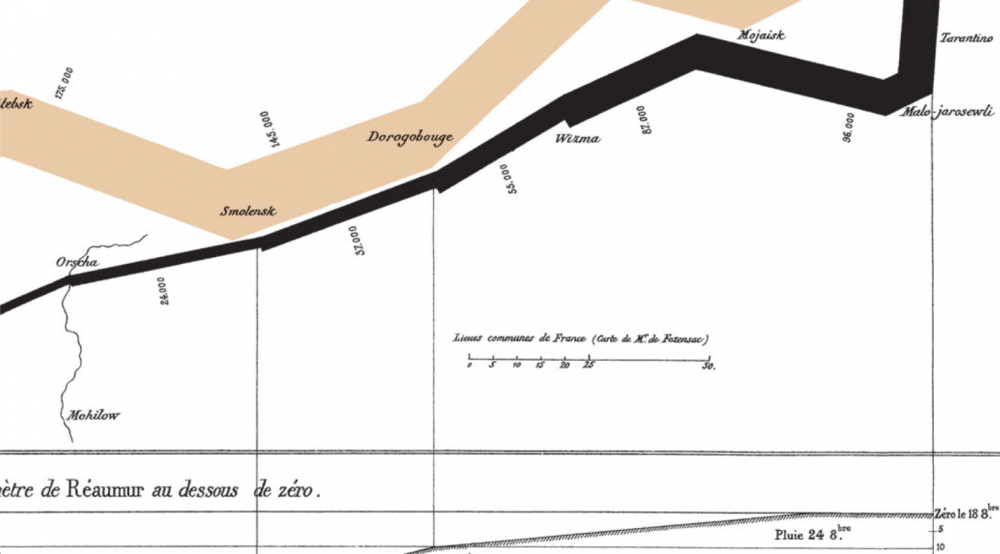
Minard’s chart shows six types of information: geography, time, temperature, the course and direction of the army’s movement, and the number of troops remaining. The widths of the gold (outward) and black (returning) paths represent the size of the force, one millimetre to 10,000 men. Geographical features and major battles are marked and named, and plummeting temperatures on the return journey are shown along the bottom.
This was hardly Minard’s first infographic. In fact, he made “scores of other graphics and charts,” National Geographic writes, “as well as nearly 50 maps. He pioneered several important thematic mapping techniques and perfected others, such as using flow lines on a map.” (See other examples of his work at National Geographic’s site.) Minard may not be much remembered for his infrastructure, but his ability, as his obituarist wrote, to turn “the dry and complicated columns of statistical data” into “images mathematically proportioned” has made him a legend in data science history circles.
Again, view Minard’s visualization of Napoleon’s failed invasion in a large format here.
Related Content:
Josh Jones is a writer and musician based in Durham, NC. Follow him at @jdmagness
Read More...David Bowie’s “Space Oddity” and the Apollo 11 Moon Landing Turn 50 This Month: Celebrate Two Giant Leaps That Took Place 9 Days Apart
One might call the explosion of “space rock” in the late 60s another kind of escapism, a turn from the heaviness on planet Earth when the Age of Aquarius started to get seriously dark. Assassinations, riots, illegal wars, blunt state repression, counterculture fragmentation, violence everywhere, it seemed. Hallucinogens played their part in guiding the music’s direction, but who could blame bands and fans of bands like the Grateful Dead, Pink Floyd, Hawkwind, or Hendrix for turning their gaze skywards and contemplating the stars?
One might also make the case that so-called “space rock”—psych-rock that directly or indirectly referenced outer space, space travel, and sci-fi themes, while sounding itself like the music of the spheres on acid—in fact, turned squarely toward the most technologically-advanced, ambitious proxy battle of the entire Cold War. The very earthly space race made a fitting subject for rock opera—a perfect stage set for imaginative songs about alienation, isolation, and technological inhumanity.
All of these themes come together in a celestial harmony in David Bowie’s 1969 single, “Space Oddity,” released on July 11th 1969 and inspired by Stanley Kubrick’s 2001: A Space Odyssey, both cultural artifacts that anticipated the drama of the Apollo 11 moon landing. The excitement Kubrick’s film and Bowie’s song helped generate is odd, however, considering that both narratives end with their protagonists lost in outer space forever.
This didn’t stop the BBC from using “Space Oddity” to soundtrack their Apollo coverage, “despite its chilling conclusion,” writes Jason Heller, author of Strange Stars: David Bowie, Pop Music, and the Decade Sci-Fi Exploded. The song’s scenario “couldn’t have been further from the typical cheerleading of the astronauts that was being conducted by the media. No one was more surprised than Bowie,” who commented:
I’m sure they really weren’t listening to the lyrics at all. It wasn’t a pleasant thing to juxtapose against a moon landing…. Obviously, some BBC official said, ‘Oh, right then, that space song, Major Tom, blah blah blah, that’ll be great.’ ‘Um, but he gets stranded in space, sir.’ Nobody had the heart to tell the producer that.
“Of course,” says Bowie, ”I was overjoyed that they did” run with the song. It had been his label’s intent to garner this kind of exposure when they rushed the record’s release to “capitalize on the Apollo craze.” “Space Oddity” made it to number five on the UK charts. But if Bowie was making any comment on the moon mission, at first it seems he did so only indirectly, inspired more by cinema than current events. He found 2001 “amazing,” he commented, adding, “I was out of my gourd anyway, I was very stoned when I went to see it, several times, and it was really a revelation to me.”
The song, he says, came out of that enhanced viewing experience. Heller writes of several more of Bowie’s literary sci-fi influences, but not of a particular interest in the Apollo program. Yet Bowie, who recorded the first “Space Oddity” demo in January of 1969, did say he wanted the song “to be the first anthem of the Moon.” The lyrics also “came from a feeling of sadness,” he said, about the space program’s direction. “It has been dehumanized,” he said. “Space Oddity” represented a deliberate “antidote to space fever,” which is maybe why the song didn’t catch on in the U.S. until the ‘70s.
This was not a song about planting a flag of conquest. Journalist Chris O’Leary remembers Bowie making even more pointed commentary, considering “the fate of Major Tom to be the technocratic American mind coming face-to-face with the unknown and blanking out.” The song heralded not only a pivotal scientific achievement but a cultural break: “It was probably not hyperbole to assert that the Age of Aquarius ended when man walked on the Moon,” writes sociologist Philip Ennis. Or as Camille Paglia interpreted events in Bowie’s song, “we sense that the ‘60s counterculture has transmuted into a hopelessness about political reform.”
This may seem like a lot of interpretation to lay on what Bowie himself called a “song-farce,” but when we’re talking about Bowie’s songwriting, even throwaway lines seem filled with portent. And when it comes to that supremely ambivalent couplet “Planet Earth is blue / And there’s nothing I can do,” we find ourselves legitimately asking along with Heller, is this “anthem or requiem? Celebration or deconstruction?” It has been all these things—the “defining song of the Space Age,” sung by astronauts themselves while floating in the tin can of the International Space Station, and soon to be broadcast at the Kennedy Center in a new video celebrating the 50th anniversary of the Apollo 11 moon landing.
The video at the NASA event on July 20th will commemorate the event with “footage of David Bowie performing Space Oddity at his 50th birthday concert at Madison Square Garden in 1997.” At the top of the post, see a later video for the song (the first film Bowie made, in 1969, would not emerge until 1984); further up, see an excellent live performance as Ziggy Stardust and the Spiders from Mars; and just above, see a young, fresh, bell-bottomed, pre-glam Bowie play “Space Oddity” live on TV in 1969.
As we remember the 50th anniversary of the moon landing this month, we also celebrate the release of “Space Oddity” just nine days earlier, the song that first launched Bowie’s career as a spacefaring rock star. He couldn’t have predicted the success of the Apollo 11 mission, but now it seems we cannot properly remember it without also reflecting on his prescient pop critique—an attempt, he said, “to relate science and emotion.”
Related Content:
How “Space Oddity” Launched David Bowie to Stardom: Watch the Original Music Video From 1969
Josh Jones is a writer and musician based in Durham, NC. Follow him at @jdmagness
Read More...Lennon or McCartney? Scientists Use Artificial Intelligence to Figure Out Who Wrote Iconic Beatles Songs
Do you agonize over the fact that you don’t know for certain who wrote what percentage of your favorite Beatles songs? Do you need to know if a line or phrase is Lennon or McCartney’s before you can enjoy “A Hard Day’s Night,” “In My Life,” and other timeless tunes? Have you lost sleep over the disputed authorship of “Do You Want to Know a Secret”?
I hope not. As Lennon/McCartney themselves wrote, in the end, the songs we love are equal to the love we give the songs…. or something like that. How much we can say with certainty who penned which lyric or melody or played which riff or rhythm part doesn’t add to our emotional experience. But that knowledge does add more to our appreciation than fodder for forum wars or lawsuits.
Pulling these iconic songs into their constituent parts helps confirm our understanding of how those parts contributed differently to making the whole evolve; how Lennon’s directness and simplicity complemented and contrasted with McCartney’s use of “more non-standard musical motifs” and a higher degree of complexity. Or, at least, that’s what an AI found when it analyzed hundreds of Beatles hits in an effort to “build a ‘musical fingerprint’ for each songwriter,” reports Alex Matthews-King at the Independent.
After putting the machine learning algorithm through an initial training phase of “listening” to a complete works, researchers at Harvard “asked” the program to assess “iconic songs, or musical fragments, recorded between 1962 and 1966, where debate rages over who was the major influence.” Much of that debate has been fueled by the songwriters themselves, whose memories in interviews conflict, but who are generally thought to have written most songs individually under their joint songwriting partnership.
The scientists from Harvard and Dalhousie University in Canada were able to gauge with somewhere around 76 percent accuracy whether songs or parts of songs were written by Lennon or McCartney. (Spoiler alert: The AI “was able to identify some, including ‘Ask Me Why’, ‘Do You Want to Know a Secret’ and the bridge to ‘A Hard Day’s Night’, as belonging to John Lennon with up to 90 per cent certainty,” writes The Daily Mail.) Senior lecturer in statistics at Harvard and paper author Mark Glickman explains the larger purpose of the project to the Financial Times: “Our work is essentially a blueprint for those wanting to follow changes in music over time. Using our machine learning model, you could potentially home in on all the different influences of a given musician.”
If you’re using their work to win arguments, be prepared to explain how the study obtained its results and why they are any more reliable than decades of detective work and expert listening by humans. As a non-statistics person, I’ll leave that explanation to more qualified individuals. I’m satisfied: whether McCartney wrote all of the music for “In My Life” or just the bridge, as Lennon claimed, won’t change the way it moves me one bit.
Related Content:
A Brief History of Sampling: From the Beatles to the Beastie Boys
Josh Jones is a writer and musician based in Durham, NC. Follow him at @jdmagness
Read More...Support Us
We're hoping to rely on loyal readers, rather than erratic ads. Please click the Donate button and support Open Culture. You can use Paypal, Venmo, Patreon, even Crypto! We thank you!

About Us

Open Culture scours the web for the best educational media. We find the free courses and audio books you need, the language lessons & educational videos you want, and plenty of enlightenment in between.
Advertise With Us

FREE UPDATES!
GET OUR DAILY EMAIL
Get the best cultural and educational resources on the web curated for you in a daily email. We never spam. Unsubscribe at any time.
FOLLOW ON SOCIAL MEDIA

Open Culture editor Dan Colman scours the web for the best educational media. He finds the free courses and audio books you need, the language lessons & movies you want, and plenty of enlightenment in between.
Advertise With Us