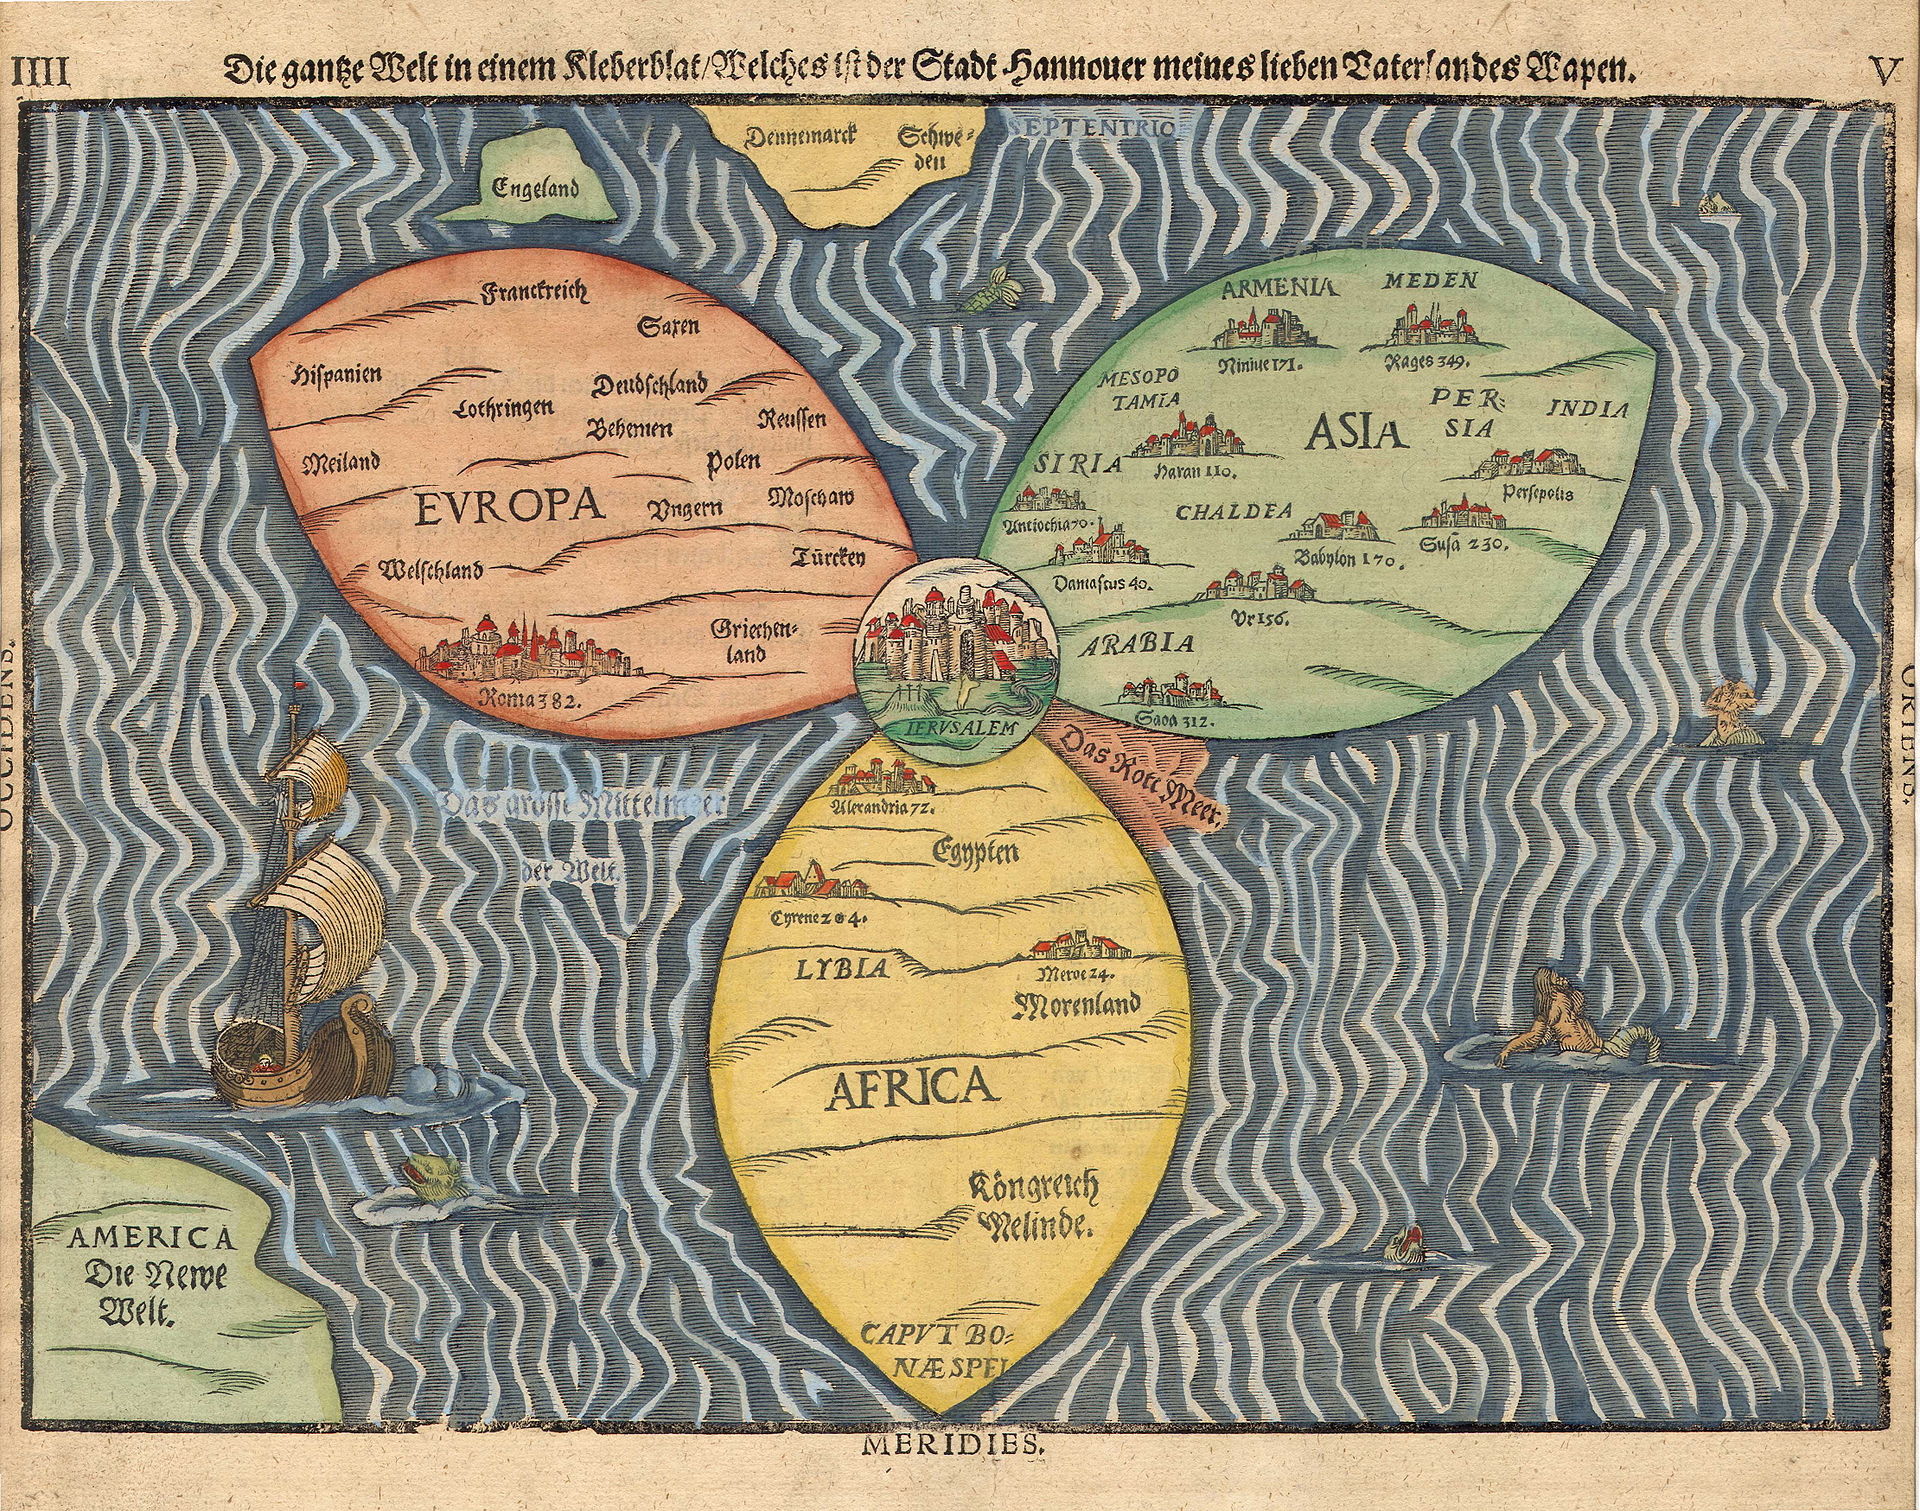
In 1581, the medieval cartographer and Protestant theologian Heinrich Bünting created a symbolic map of the world that adorned his book Itinerarium Sacrae Scripturae(Travel Through Holy Scripture). Hand-colored and shaped like a three-leaf clover, the map put Jerusalem at its center, highlighting its central role in Christianity, Judaism, and Islam. From that center flowed three continents—Europe, Africa, and Asia—each surrounded by swirling waters teeming with ships, mermaids, and sea monsters. Then, off to one side, we find a barren “America,” otherwise known as the “New World.”
If you would like to support the mission of Open Culture, consider making a donation to our site. It’s hard to rely 100% on ads, and your contributions will help us continue providing the best free cultural and educational materials to learners everywhere. You can contribute through PayPal, Patreon, and Venmo (@openculture). Thanks!
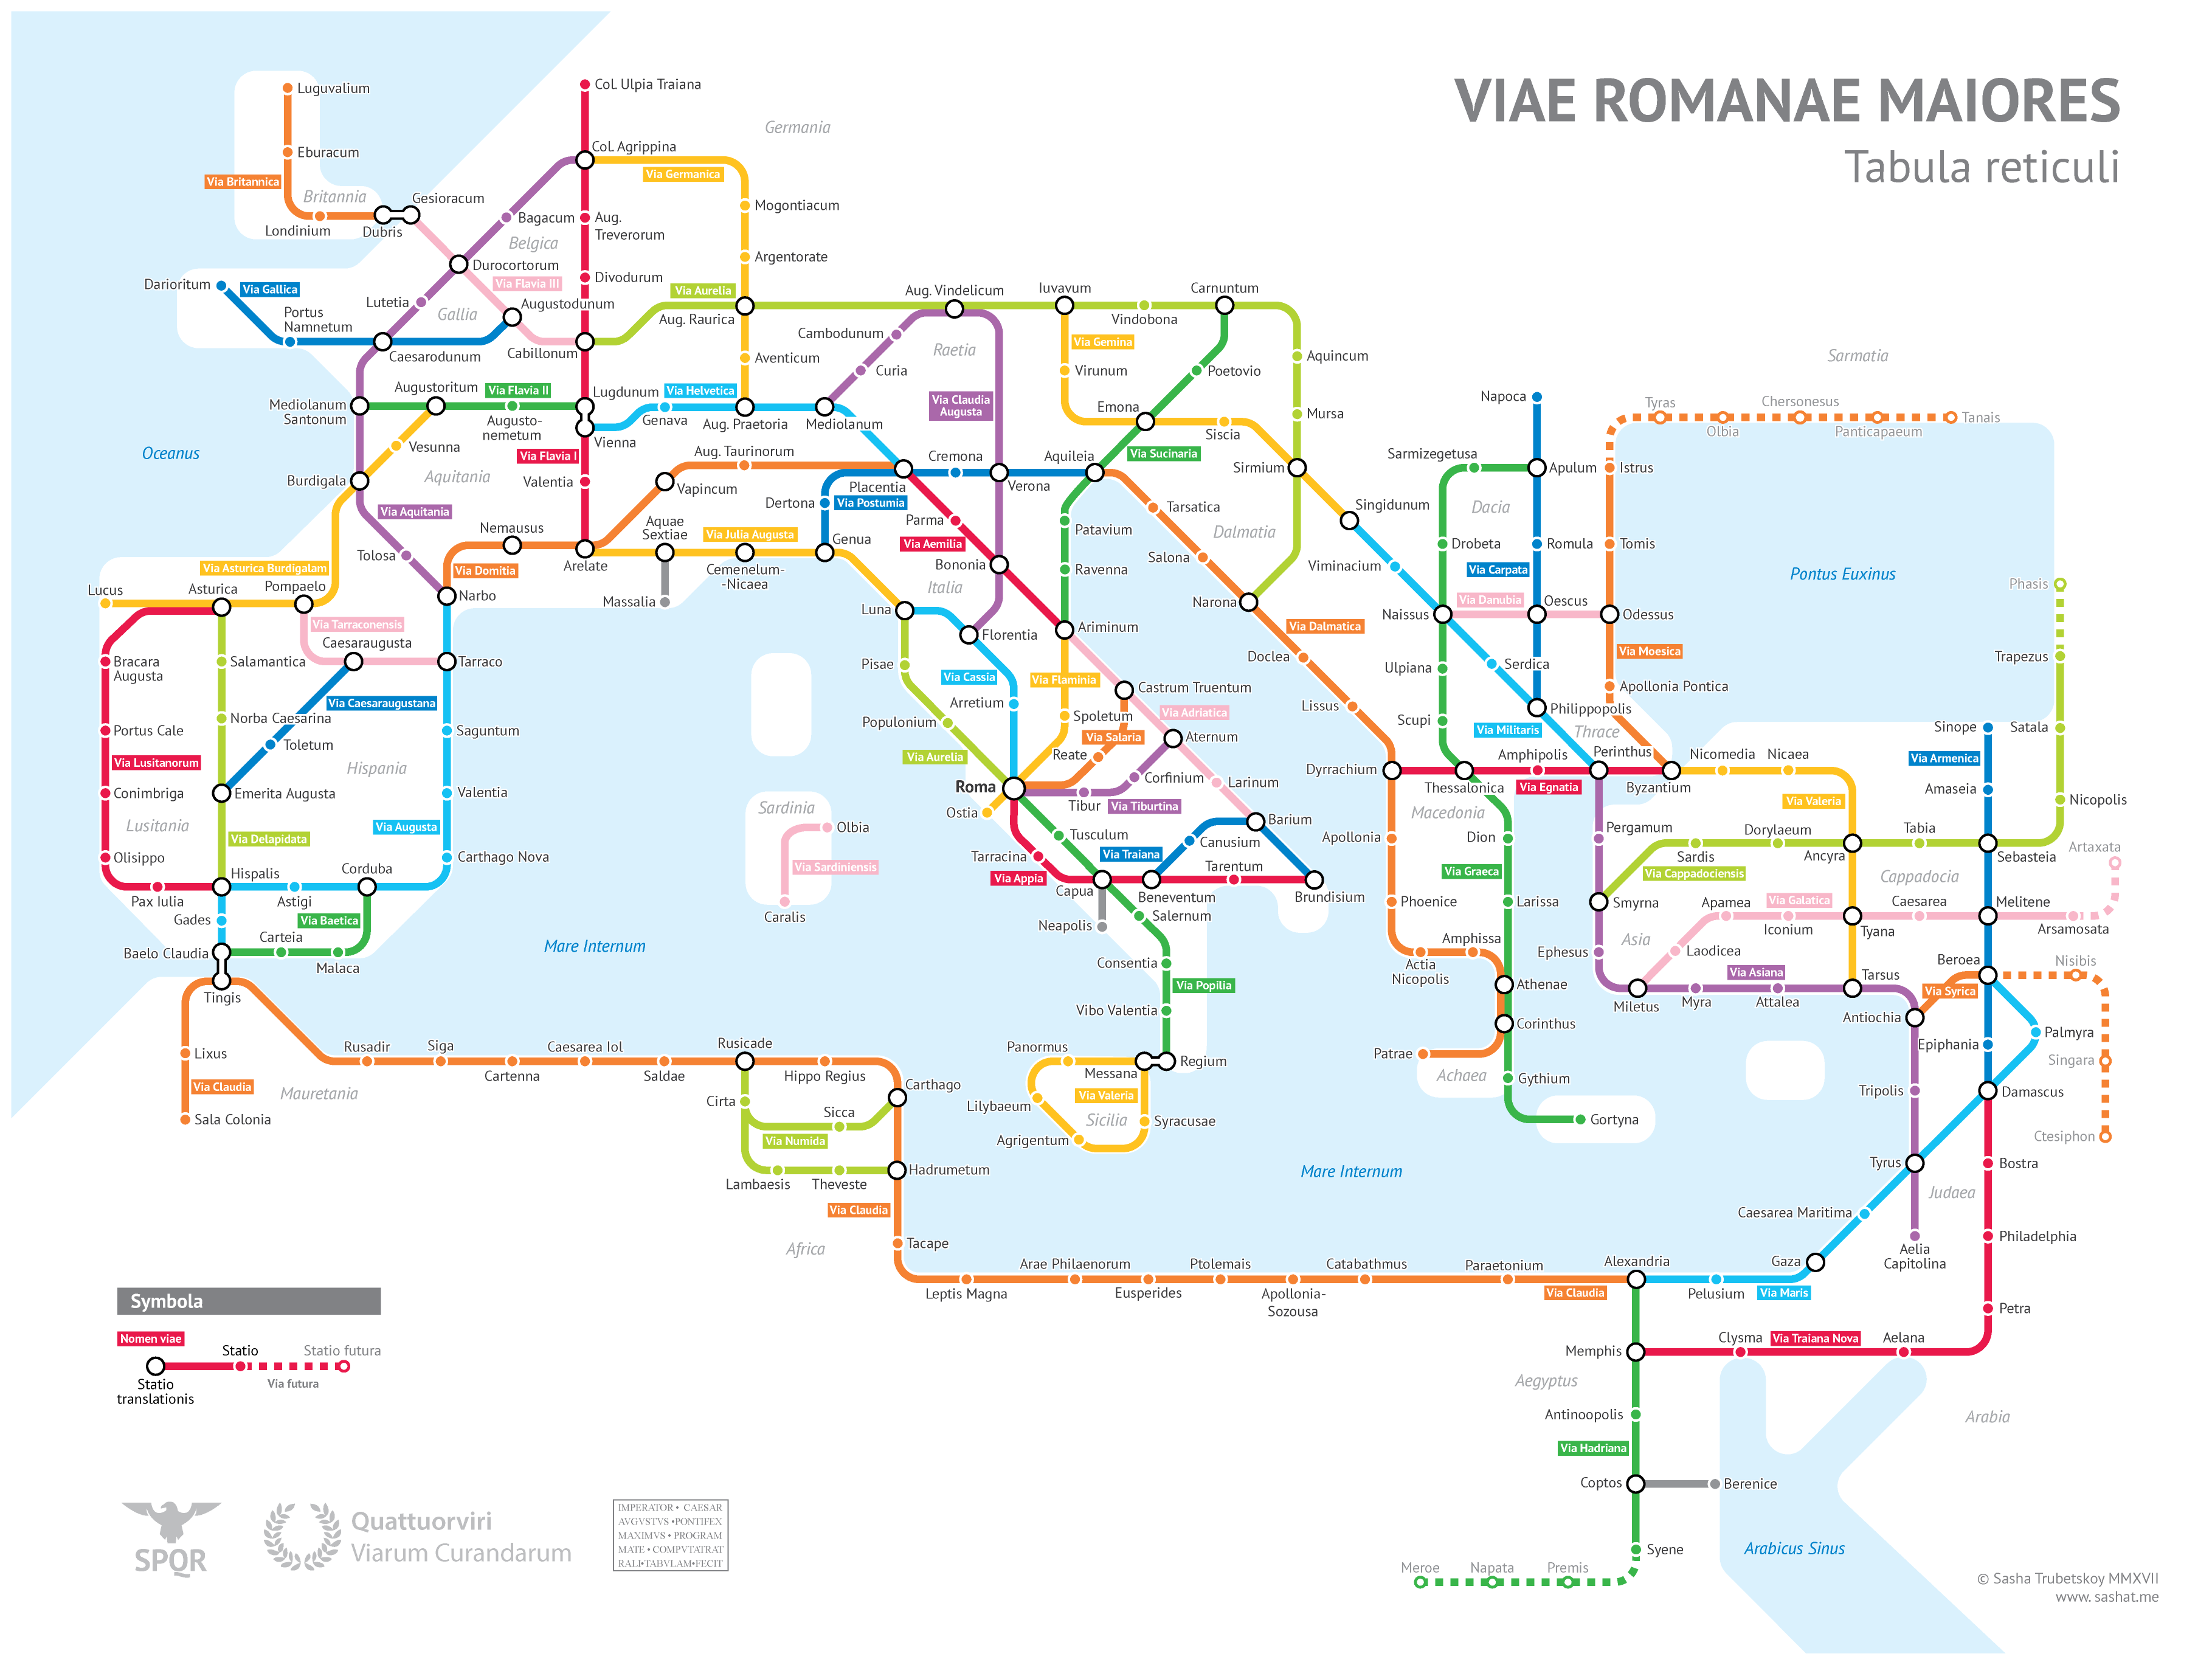
In an age when many of us could hardly make our way to an unfamiliar grocery store without relying on a GPS navigation system, we might well wonder how the Romans could establish and sustain their mighty empire without so much as a proper map. That’s the question addressed by the Historia Militumvideo above, “How Did Ancient People Travel Without Maps?” Or more to the point, how did they travel without scaled maps — that is, ones “in which the map’s distances were proportional to their actual size in the real world,” like almost all those we consult on our screens today?
The surviving maps from the ancient Roman world tend not to take great pains adhering to true geography. Yet as the Roman Empire expanded, laying roads across three continents, more and more Romans engaged in long-distance travel, and for the most part seem to have arrived at their intended destinations.
To do so, they used not maps per se but “itineraries,” which textually listed towns and cities along the way and the distance between them. By the fourth century, “all main Roman roads along with 225 stopping stations were compiled in a document called the Itinerarium Antonini, the Itinerary of Emperor Antonius Pius.”
This highly practical document includes mostly roads that “passed through large cities, which provided better facilities for housing, shopping, bathing, and other traveler needs.” With this information, “a traveler could copy the specific distances and stations they needed to reach their destination.” Still today, some seventeen centuries later, “most people wouldn’t use a paper scaled map for travel, but would instead break their journey down into a list of subway stations, bus stops, and intersections.” And if you were to attempt to drive across Europe, making a modern-day Roman Empire road trip, you’d almost certainly rely on the distances and points of interest provided by the synthesized voice reading aloud from the vast Itinerarium Antonini of the twenty-first century.
Based in Seoul, Colin Marshall writes and broadcasts on cities, language, and culture. His projects include the Substack newsletterBooks on Cities and the book The Stateless City: a Walk through 21st-Century Los Angeles. Follow him on Twitter at @colinmarshall.
No matter what country we live in, we’ve all fantasized about taking our own great American road trip, considering a variety of the infinitely many possible routes. The most obvious would be driving between Los Angeles and New York, a distance of 2,800 miles that would take a bit over 40 hours straight through. I myself once took a more southerly route, road-tripping from Los Angeles to Raleigh, North Carolina over a week or two; these days, I dream of an east-coast journey from Maine all the way down to Key West, a relatively manageable 1,900 miles. But if you take your road-tripping seriously, you’ve got to go to another continent entirely.
Such is the conclusion to be drawn from the Half as Interesting video above, which finds the longest drivable distance on Earth. “The North American road system goes as far as Prudhoe Bay in Canada’s Canada, Alaska, and as far south as Yaviza in Panama,” says the video’s creator Sam Denby, “but this only clocks in at 7,500 miles.”
That may require six straight days of driving, but it doesn’t set any records. A route from southern Africa and east Asia may seem promising, but they can’t be driven without passing through western Europe. That requires passage across the Mediterranean on a ferry, which — for the true road-tripper — taints the purity of the endeavor.
Starting in Europe, then, you should begin in Sagres, Portugal, “the most extreme point on the contiguous road network.” From there, you can drive as far east as “the banks of the Aldan River in Russia,” a distance of 8,437 miles. But wait, there’s longer: you could keep going to Khasan, “the only Russian town to border North Korea,” and bring the mileage up to 8,726, thus completing “the longest direct driving route in the world.” If you go pedal-to-the-metal (to the extent possible while observing local speed limits, anyway) it will take six days and 19 hours — bookended, ideally, by one meal of cataplana and another of Khasan oysters.
Based in Seoul, Colin Marshall writes and broadcasts on cities, language, and culture. His projects include the Substack newsletterBooks on Cities and the book The Stateless City: a Walk through 21st-Century Los Angeles. Follow him on Twitter at @colinmarshall or on Facebook.
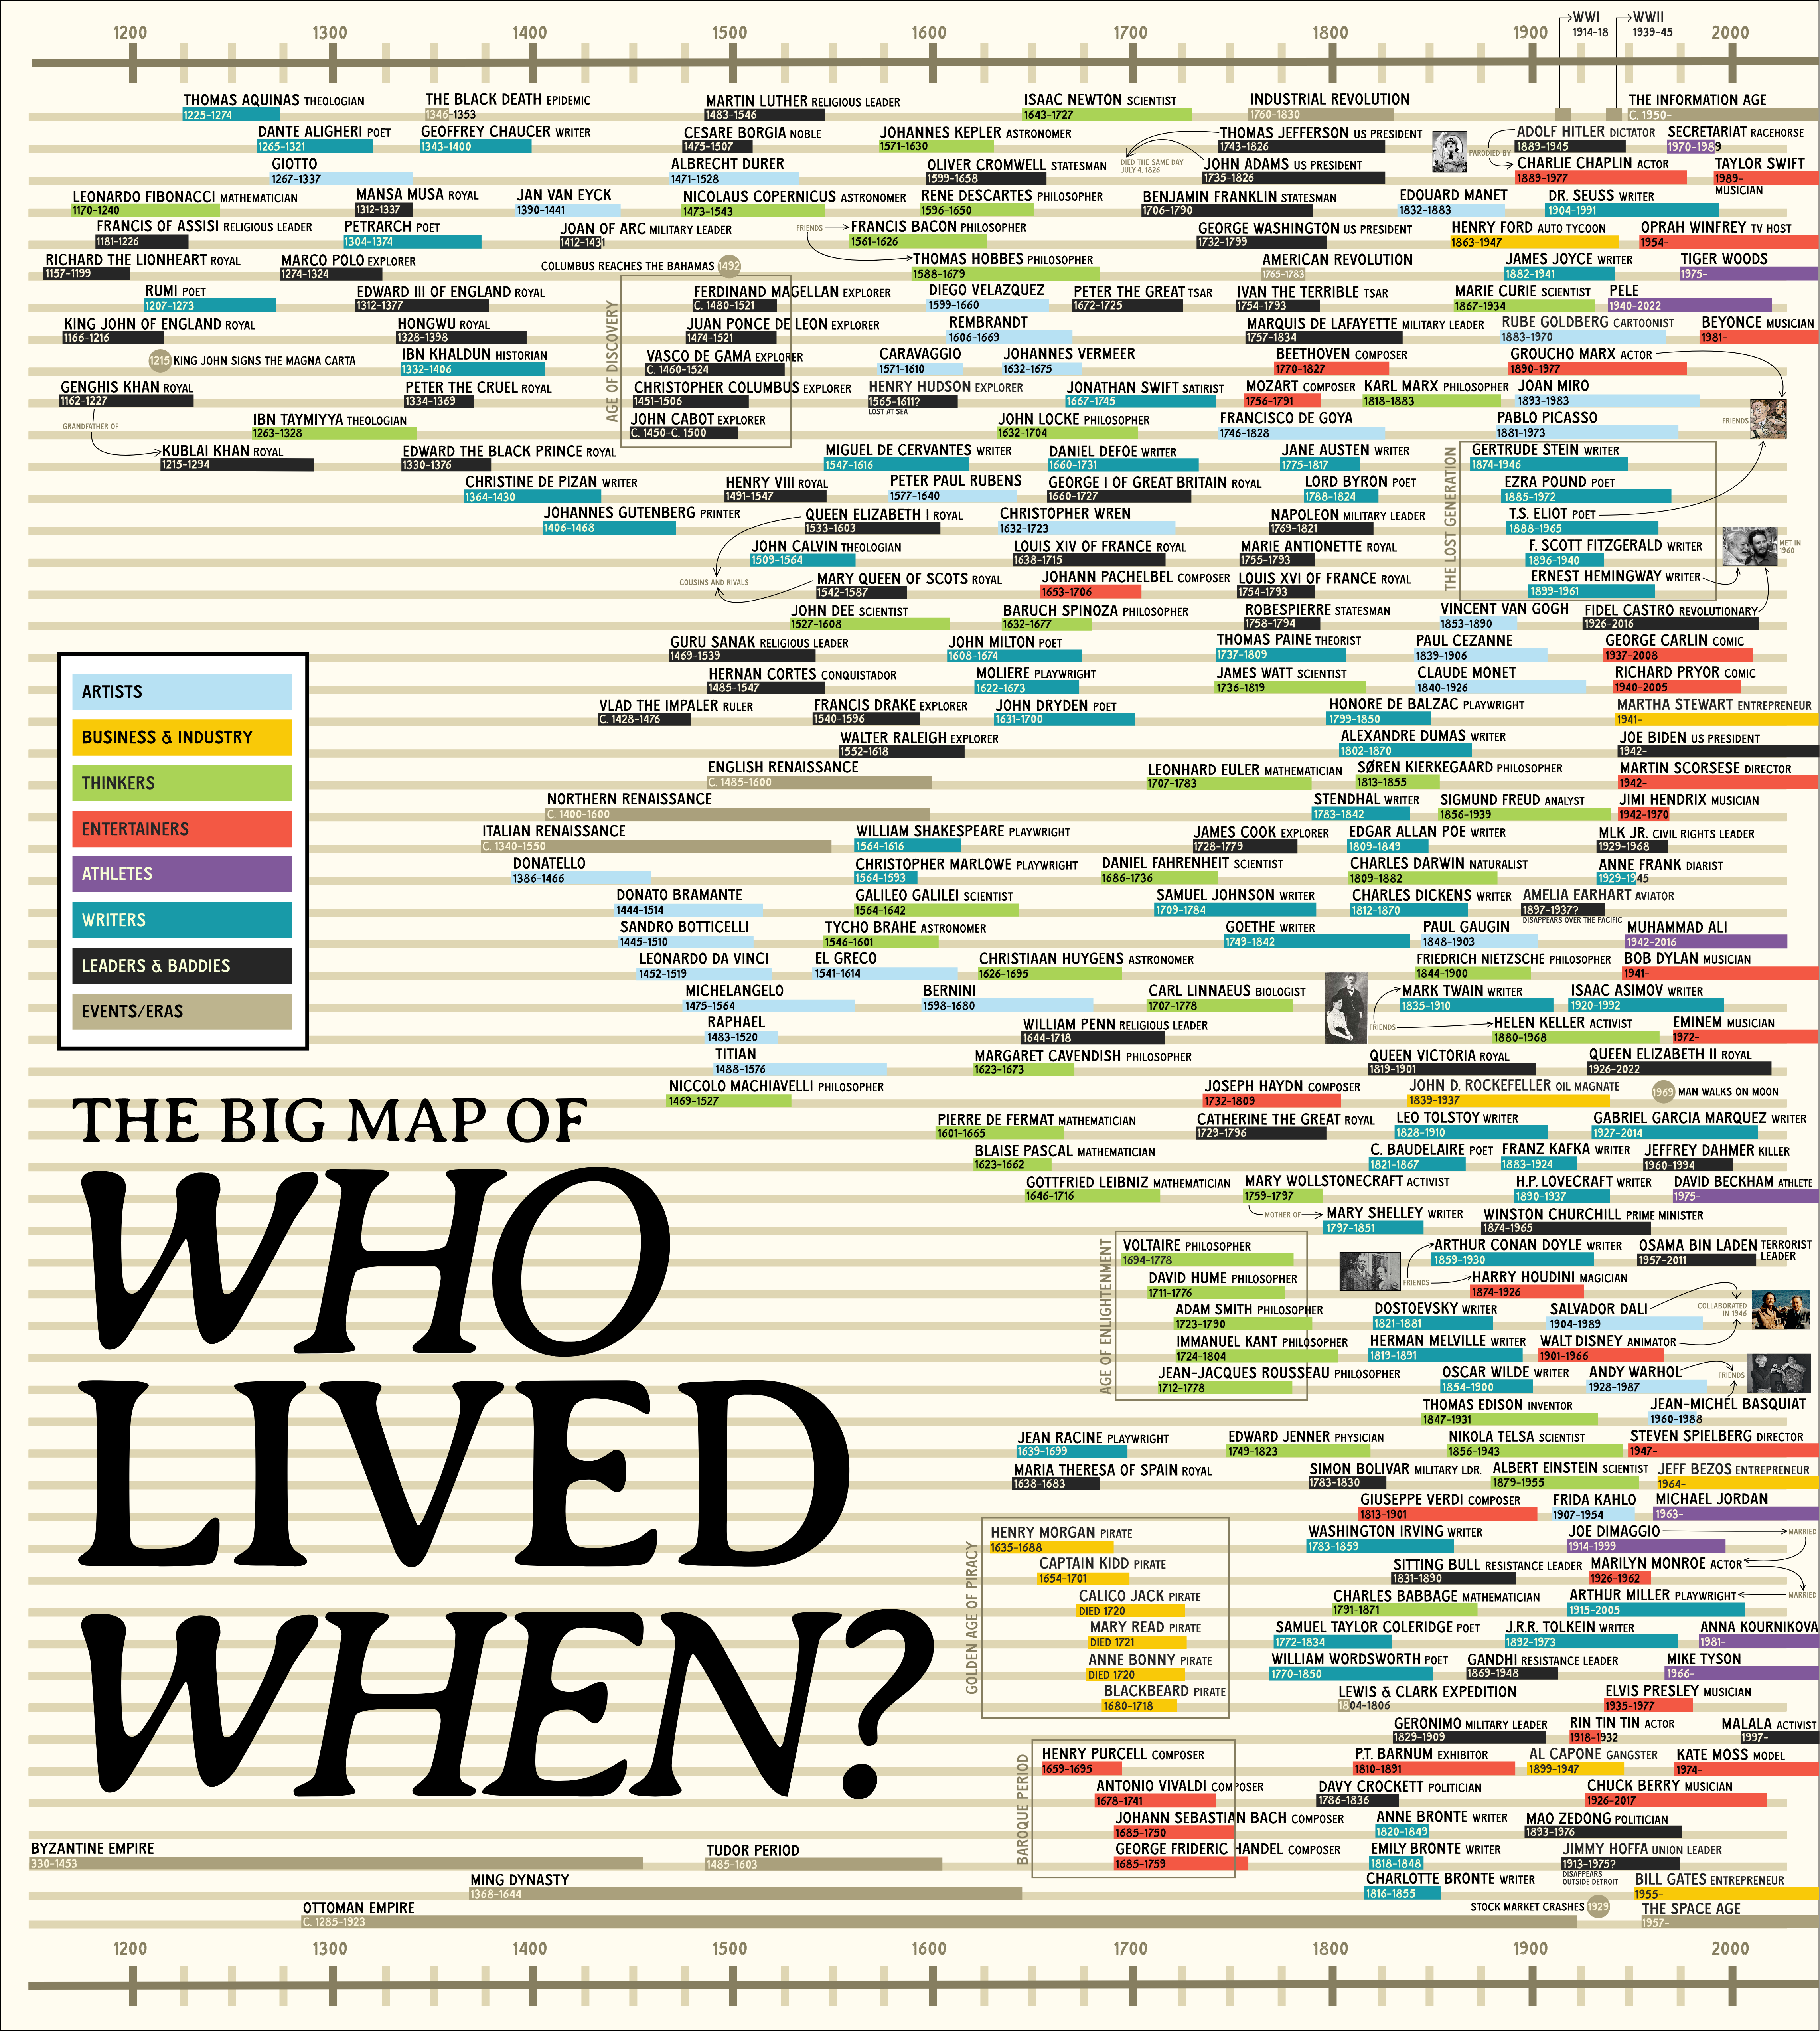
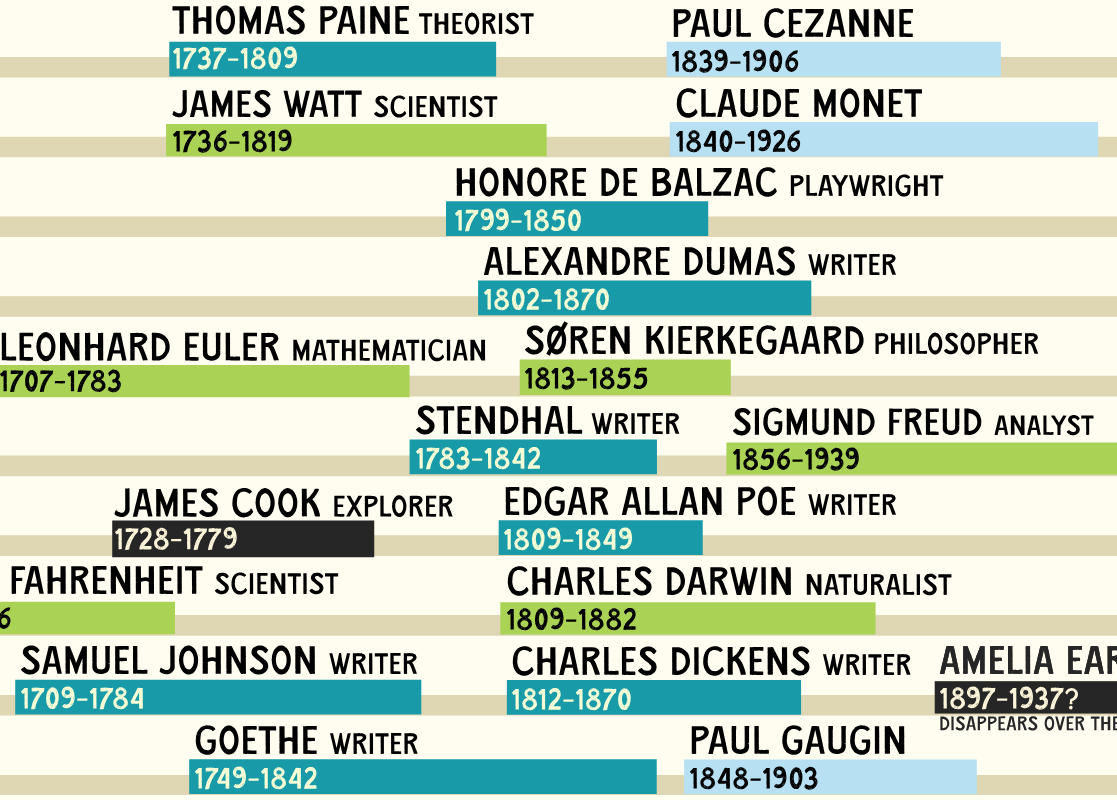
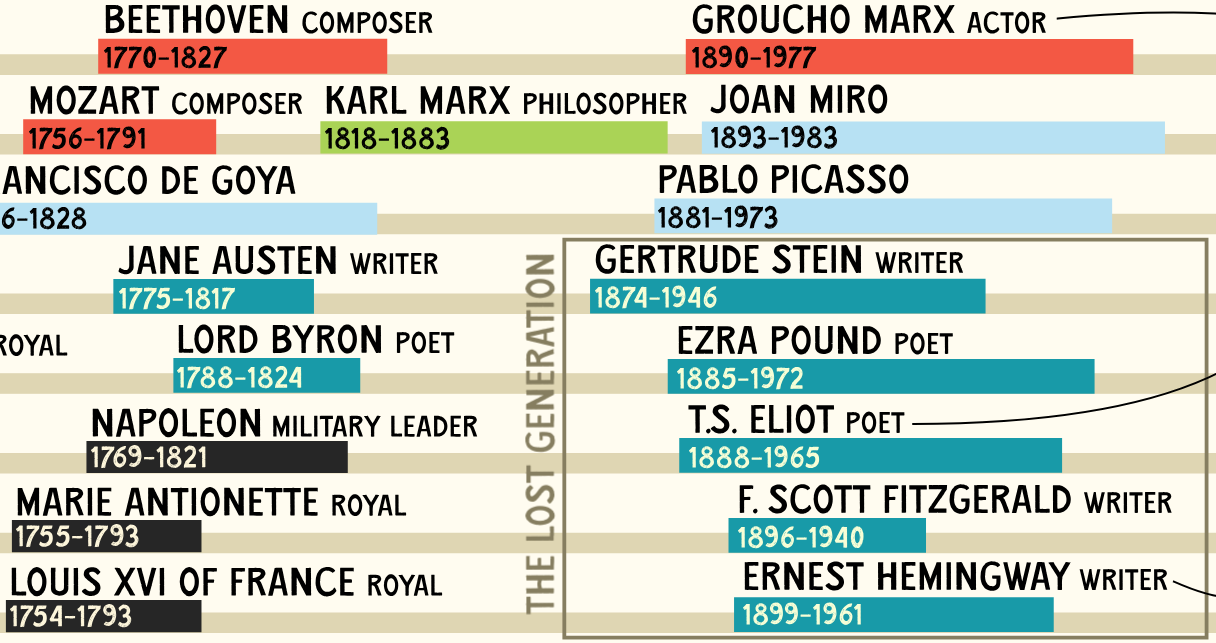
We could call the time in which we live the “Information Age.” Or we could describe it more vividly as the era of Bill Gates and Jeff Bezos, Martin Scorsese and Steven Spielberg, Oprah Winfrey and Martha Stewart, Beyoncé and Bob Dylan. Whatever you think of the work of any of these figures in particular, you can hardly deny the impact they’ve had on our culture. Were we living a century ago, we might have said the same of Henry Ford and John D. Rockefeller, James Joyce and F. Scott Fitzgerald (though he hadn’t quite published The Great Gatsby yet), Pablo Picasso and Charlie Chaplin, Marie Curie and Sigmund Freud.
Were we living in the year 1225, our lives would’ve overlapped with those of Leonardo Fibonacci, Francis of Assisi, Rumi, and Thomas Aquinas, as well as both Genghis Khan and his grandson Kublai Khan.
All this is laid out visually in The Big Map of Who Lived When, created earlier this year by a Reddit user called Profound_Whatever. As Big Think’s Frank Jacobswrites, the map reveals surprising instances of contemporaneousness, such as that current U.S. President Joe Biden “for about a year was alive at the same time as Nikola Tesla (1854–1943), the Serbian-American inventor who developed the alternating current (AC) system that is used for distributing electricity.”
For “another, more recent (and more baffling) overlap: The life of J.R.R. Tolkien (1892–1973), who wrote The Lord of the Rings, coincided ever so slightly with that of Eminem.” Going farther into the past, how many of us were fully aware that “Christopher Columbus (1451–1506), Leonardo da Vinci (1452–1519), and Martin Luther (1483–1546) were contemporaries of each other”? Or that “the lives of Oliver Cromwell (1599–1658) and René Descartes (1596–1650) synced almost perfectly with each other, despite the one being the dogmatically Puritan figurehead of the English Civil War, and the other the father of modern, rationalist philosophy by giving doubt to a central role in the pursuit of truth”?
The Big Map of Who Lived When uses a color-coding system to divide the figures whose lifespans it charts into eight categories, including artists (Leonardo da Vinci, Rube Goldberg), thinkers (John Locke, Charles Darwin), “business & industry” (including famed pirates from Henry Morgan to Blackbeard), and “leaders & baddies” (Napoleon, Adolf Hitler). It all reminds us that we’d give anything for a chance to meet some of them, or to stay out of the path of others. Of course, the individuals we think of as having defined a particular historical era weren’t always regarded that way by everyone else who lived at the same time: something it wouldn’t hurt to bear in mind when considering our own place in history.
Based in Seoul, Colin Marshall writes and broadcasts on cities, language, and culture. His projects include the Substack newsletterBooks on Cities and the book The Stateless City: a Walk through 21st-Century Los Angeles. Follow him on Twitter at @colinmarshall or on Facebook.
In 2017, we brought you news of a world map purportedly more accurate than any to date, designed by Japanese architect and artist Hajime Narukawa. The map, called the AuthaGraph, updates a centuries-old method of turning the globe into a flat surface by first converting it to a cylinder. Winner of Japan’s Good Design Grand Award, it serves as both a brilliant design solution and an update to our outmoded conceptions of world geography.
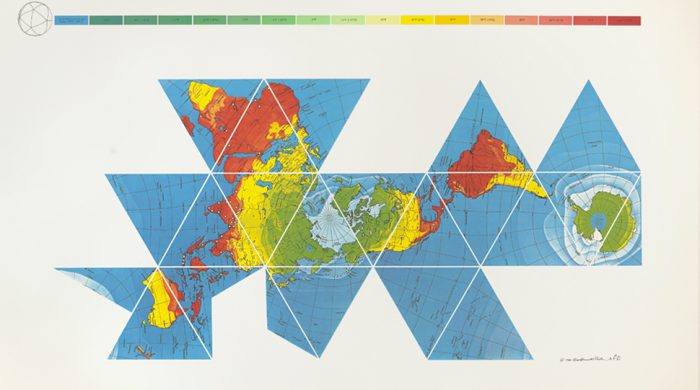
But as some readers have pointed out, the AuthaGraph also seems to draw quite heavily on an earlier map made by one of the most visionary of theorists and designers, Buckminster Fuller, who in 1943 applied his Dymaxion trademark to the map you see above, which will likely remind you of his most recognizable invention, the Geodesic Dome, “house of the future.”
Whether Narukawa has acknowledged Fuller as an inspiration I cannot say. In any case, 73 years before the AuthaGraph, the Dymaxion Map achieved a similar feat, with similar motivations. As the Buckminster Fuller Institute (BFI) points out, “The Fuller Projection Map is [or was] the only flat map of the entire surface of the Earth which reveals our planet as one island in the ocean, without any visually obvious distortion of the relative shapes and sizes of the land areas, and without splitting any continents.”
Fuller published his map in Life magazine, as a corrective, he said, “for the layman, engrossed in belated, war-taught lessons in geography…. The Dymaxion World map is a means by which he can see the whole world fairly at once.” Fuller, notes Kelsey Campbell-Dollaghan at Gizmodo, “intended the Dymaxion World map to serve as a tool for communication and collaboration between nations.”
Fuller believed, writes BFI, that “given a way to visualize the whole planet with greater accuracy, we humans will be better equipped to address challenges as we face our common future aboard Spaceship Earth.” Was he naïve or ahead of his time?
We may have had a good laugh at a recent replica of Fuller’s nearly undrivable, “scary as hell,” 1930 Dymaxion Car, one of his first inventions. Many of Fuller’s contemporaries also found his work bizarre and impractical. Elizabeth Kolbert at The New Yorker sums up the reception he often received for his “schemes,” which “had the hallucinatory quality associated with science fiction (or mental hospitals).” The commentary seems unfair.
Fuller’s influence on architecture, design, and systems theory has been broad and deep, though many of his designs only resonated long after their debut. He thought of himself as an “anticipatory design scientist,” rather than an inventor, and remarked, “if you want to teach people a new way of thinking, don’t bother trying to teach them. Instead, give them a tool, the use of which will lead to new ways of thinking.” In this sense, we must agree that the Dymaxion map was an unqualified success as an inspiration for innovative map design.
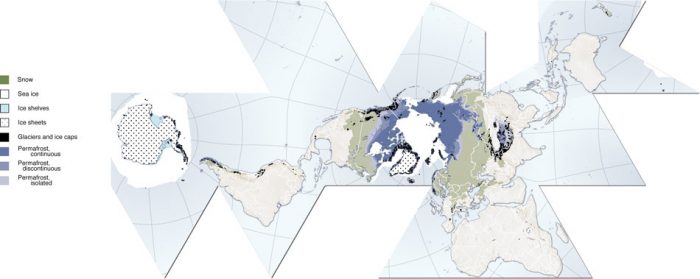
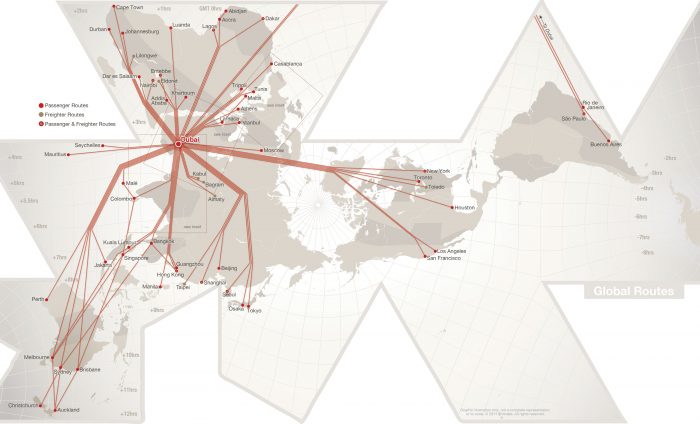
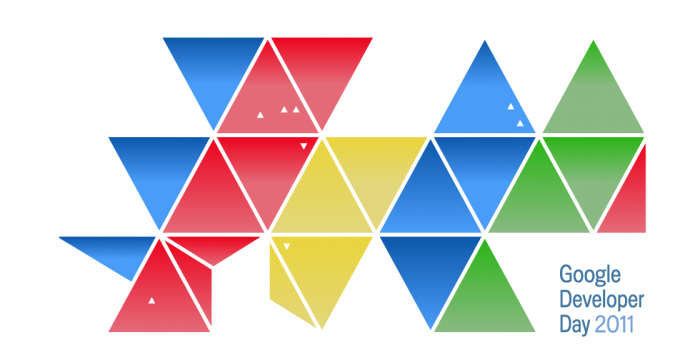
In addition to its possibly indirect influence on the AuthaGraph, Fuller’s map has many prominent imitators and sparked “a revolution in mapping,” writes Campbell-Dollaghan. She points us to, among others, the Cryosphere, further up, a Fuller map “arranged based on ice, snow, glaciers, permafrost and ice sheets”; to Dubai-based Emirates airline’s map showing flight routes; and to the “Googlespiel,” an interactive Dymaxion map built by Rehabstudio for Google Developer Day, 2011.
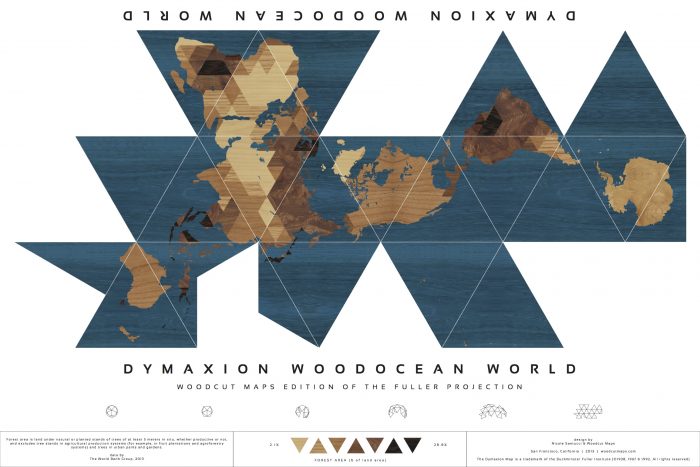
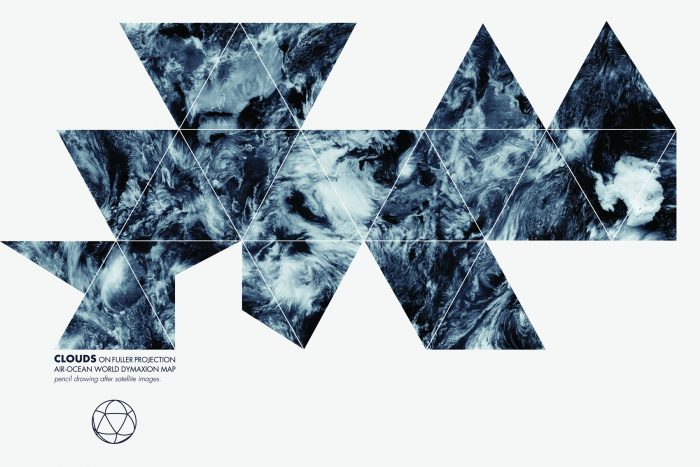
And, just above, we see the Dymaxion Woodocean World map by Nicole Santucci, winner of 2013’s DYMAX REDUX, an “open call to create a new and inspiring interpretation of Buckminster Fuller’s Dymaxion Map.” You’ll find a handful of other unique submissions at BFI, including the runner-up, Clouds Dymaxion Map, below, by Anne-Gaelle Amiot, an “absolutely beautiful hand-drawn depiction of a reality that is almost always edited from our maps: cloud patterns circling above Earth.”
Taking a first glance at the Babylonian Map of the World, few of us could recognize it for what it is. But then again, few of us are anything like the British Museum Middle East department curator Irving Finkel, whose vast knowledge (and ability to share it compellingly) have made him a viewer favorite on the institution’s Youtube channel. In the Curator’s Corner video above, he offers an up-close view of the Babylonian Map of the World — or rather, the fragment of the clay tablet from the eighth or seventh century BC that he and other experts have determined contains a piece of the oldest map of the known world in existence.
“If you look carefully, you will see that the flat surface of the clay has a double circle,” Finkel says. Within the circle is cuneiform writing that describes the shape as the “bitter river” that surrounds the known world: ancient Mesopotamia, or modern-day Iraq.
Inside the circle lie representations of both the Euphrates River and the mighty city of Babylon; outside it lie a series of what scholars have determined were originally eight triangles. “Sometimes people say they are islands, sometimes people say they are districts, but in point of fact, they are almost certainly mountains,” which stand “far beyond the known world” and represent, to the ancient Babylonians, “places full of magic, and full of mystery.”
Coming up with a coherent explanation of the map itself hinged on the discovery, in the nineteen-nineties, of one of those triangles originally thought to have been lost. This owes to the enthusiasm of a non-professional, a student in Finkel’s cuneiform night classes named Edith Horsley. During one of her once-a-week volunteer shifts at the British Museum, she set aside a particularly intriguing clay fragment. As soon as Finkel saw it, he knew just the artifact to which it belonged. After the piece’s reattachment, much fell into place, not least that the map purported to show the distant location of the beached (or rather, mountained) ark built by “the Babylonian version of Noah” — the search for which continues these nine or so millennia later.
Based in Seoul, Colin Marshall writes and broadcasts on cities, language, and culture. His projects include the Substack newsletterBooks on Cities and the book The Stateless City: a Walk through 21st-Century Los Angeles. Follow him on Twitter at @colinmarshall or on Facebook.
If you would like to support the mission of Open Culture, consider making a donation to our site. It’s hard to rely 100% on ads, and your contributions will help us continue providing the best free cultural and educational materials to learners everywhere. You can contribute through PayPal, Patreon, and Venmo (@openculture). Thanks!
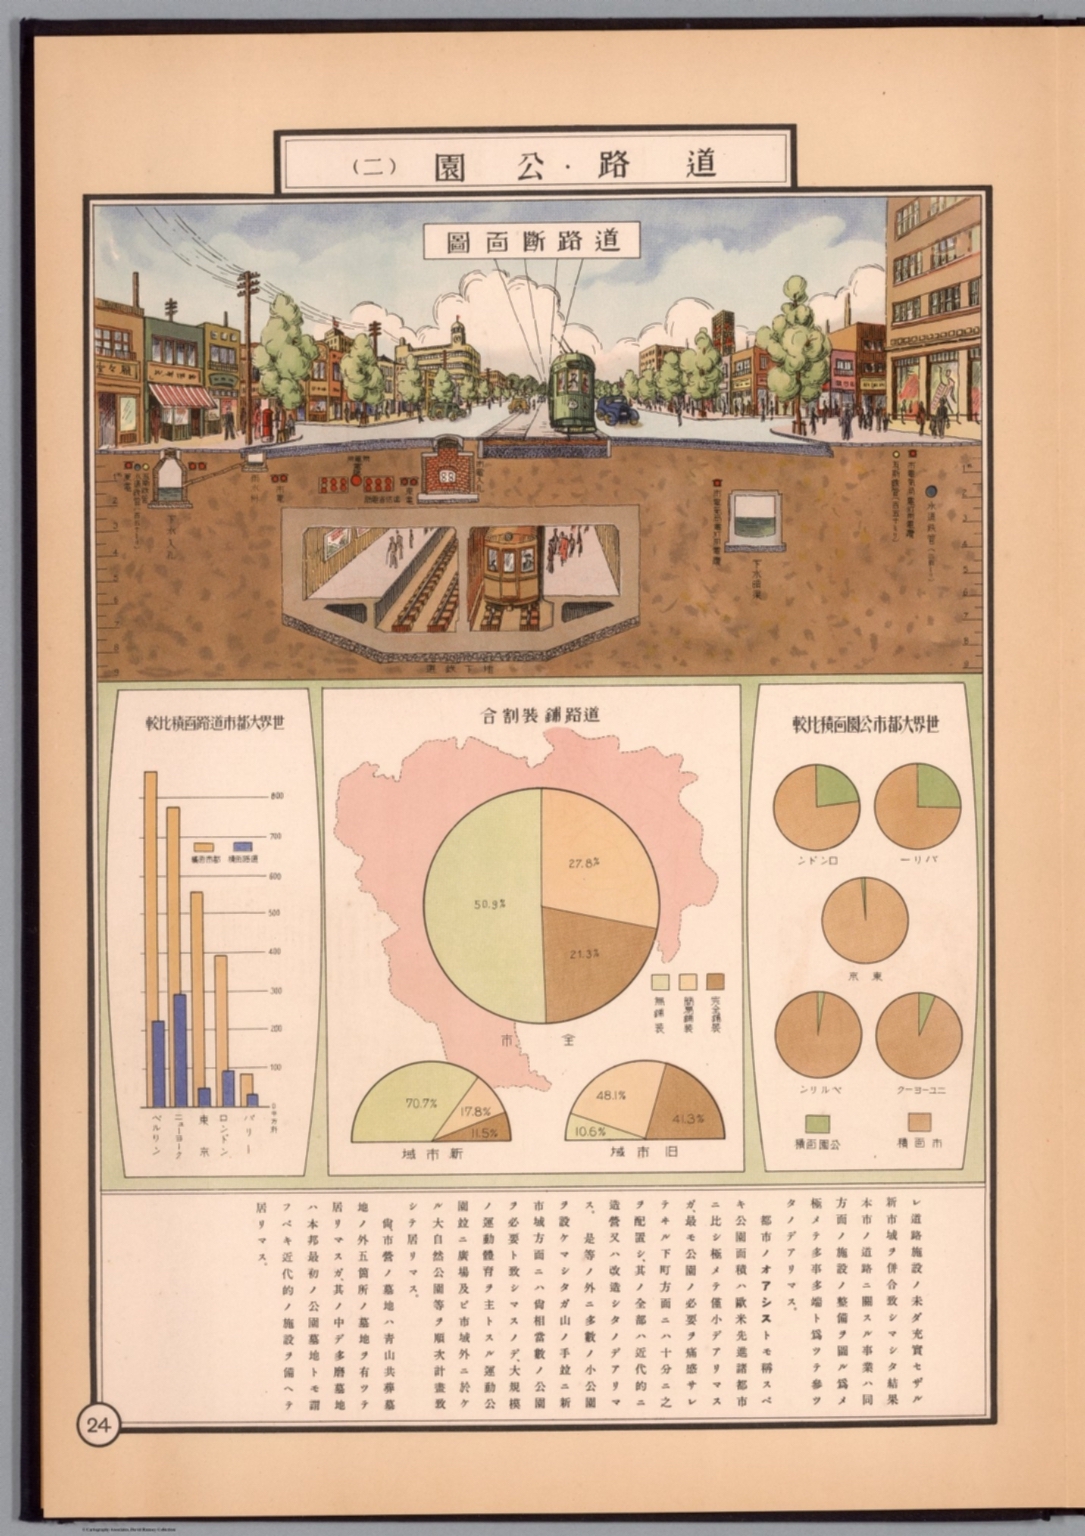
The world has changed dramatically over the past 500 years, albeit not quite as dramatically as how we see the world. That’s just what’s on display at the David Rumsey Map Collection, whose more than 131,000 historical maps and related images are available to browse (or download) free online. Since we last featured it here on Open Culture, the collection has added at least 40,000 items to its digital holdings, making it an even more valuable resource for not just understanding how humanity has viewed the world throughout the ages, but how we’ve imagined it — and, for that matter, how we’ve imagined other worlds from Mars to Narnia to Krypton.
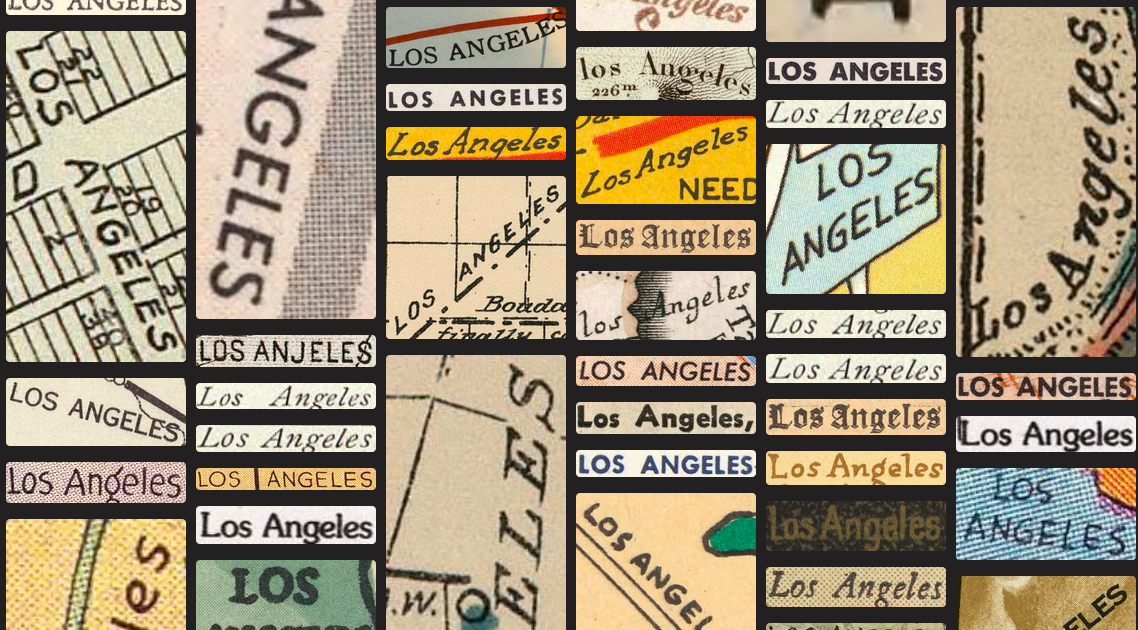
Among the site’s new features is a “search by text-on-maps” feature, which you can activate by clicking the “by Text on Maps” button next to the search window at the top of the page. This lets you compare and contrast the ways particular places have been labeled on the variety of maps in the collection: not just proper names like Cairo, Madrid, and Yosemite, but also more general terms like “gold mine,”“lighthouse” or “dragons.” Arguably, we look at maps more often here in the twenty-first century than we ever did before, though seldom if ever do we depart from whichever mapping app we happen to keep on our phones. It’s worth stepping back in cartographical time to remember that there were once as many ways of understanding the world as there were depictions of it.
Based in Seoul, Colin Marshall writes and broadcasts on cities, language, and culture. His projects include the Substack newsletterBooks on Cities, the book The Stateless City: a Walk through 21st-Century Los Angeles and the video series The City in Cinema. Follow him on Twitter at @colinmarshall or on Facebook.
We're hoping to rely on loyal readers, rather than erratic ads. Please click the Donate button and support Open Culture. You can use Paypal, Venmo, Patreon, even Crypto! We thank you!
Open Culture scours the web for the best educational media. We find the free courses and audio books you need, the language lessons & educational videos you want, and plenty of enlightenment in between.

