Venice Explained: Its Architecture, Its Streets, Its Canals, and How Best to Experience Them All
“If you’re in Venice, you might not enjoy it so much if you follow a tour-guide route that gets you to the main attractions.” So says Youtuber Manuel Bravo — whom we’ve previously featured here on Open Culture for his videos on Pompeii, the Duomo di Firenze, and the Great Pyramids of Giza — in “Venice Explained” just above. “But if you get off that road, the charm of Venice is that it’s such a tangled mess that nobody ventures out there” — out, that is, into the “wonderful little neighborhoods with little squares with cisterns and little cafés.” Diminutive though that may sound, Venice comes off in Bravo’s analysis as an entire, unique urban realm unto itself.
“Historically, Venice is really detached from Italy proper,” Bravo says. “It was not a Roman town. It does not have the detritus of Roman ruins scattered around. It does not have remnants of a Roman town plan with cardo and decumanus. It does not even have, well, land.”
Indeed, Venice is famous for having been built in the Adriatic Sea, on a “new fortified ground plane” made of strong trees imported from Croatia. As its political and economic importance grew, so did its “incomparable medieval urban landscape that has remained practically unchanged.” This built environment is full of architectural styles and details seen nowhere else, to which Bravo draws our attention through the course of the video.
Though he recommends departing from the tourist-beaten paths, he doesn’t ignore such world-famous Venetian structures as the Ca d’Oro, “perhaps the most beautiful building in Venice”; the Doge’s Palace with its “antigravity” architecture; and — in detail — the Basilica and Piazza San Marco, “one of the most memorable spatial complexes in the history of urban planning.” No first visit would be complete without some time spent at each of these sites. But “Venice is a city of light,” and in order properly to enjoy it, we must “see it at different times of the day and experience all the nuances that it offers”: good advice in this “most visually seductive of all the cities in the world,” but also worth bearing in mind as a means of appreciating even the less majestic places in which most of us usually find ourselves.
Related content:
How Venice Works: 124 Islands, 183 Canals & 438 Bridges
Take a Virtual Tour of Venice (Its Streets, Plazas & Canals) with Google Street View
Take a High Def, Guided Tour of Pompeii
Based in Seoul, Colin Marshall writes and broadcasts on cities, language, and culture. His projects include the Substack newsletter Books on Cities, the book The Stateless City: a Walk through 21st-Century Los Angeles and the video series The City in Cinema. Follow him on Twitter at @colinmarshall or on Facebook.
Read More...A Fully Functional Replica of the Antikythera Mechanism, the First Analog Computer from Ancient Greece, Re-Created in LEGO
?si=n8hyTDl7Wn6FLq3a
Discovered amidst the wreckage of a sunken ship off the coast of Greece in 1901, the Antikythera Mechanism (previously featured here on Open Culture) is often considered the world’s oldest known analog computer. Dating back to approximately 150–100 BCE, the device has a complex arrangement of precisely cut gears, all designed to track celestial movements, predict lunar and solar eclipses, and chart the positions of planets. It’s a testament to Ancient Greek engineering. Above, you can see a fully functional replica of the Antikythera Mechanism re-created in LEGO, courtesy of the scientific journal Nature. As one YouTuber put it, “The device is unbelievably cool, and the video is masterfully done.”
If you would like to support the mission of Open Culture, consider making a donation to our site. It’s hard to rely 100% on ads, and your contributions will help us continue providing the best free cultural and educational materials to learners everywhere. You can contribute through PayPal, Patreon, and Venmo (@openculture). Thanks!
Related Content
Download Instructions for More Than 6,800 LEGO Kits at the Internet Archive
With 9,036 Pieces, the Roman Colosseum Is the Largest Lego Set Ever
Read More...
Google & Coursera Launch New Career Certificates That Prepare Students for Jobs in 2–6 Months: Business Intelligence & Advanced Data Analytics
Back in 2021, Google launched a series of online courses designed to help students earn a professional certificate in six months and also land an entry-level job. In its original offering, Google developed certificate programs in five professional areas: User Experience (UX) Design, Data Analytics, Project Management, IT Support and IT Automation. Now, the tech company has added two new programs to its lineup, each offered through Coursera’s online education platform.
First, the Google Advanced Data Analytics Professional Certificate builds on the original Data Analytics Certificate and “delves into machine learning, predictive modeling, and experimental design to collect and analyze large amounts of data.” Featuring seven courses in total, the program takes roughly six months to complete and aims to teach students how to 1) build regression and machine learning models to analyze and interpret data, 2) create data visualizations and apply statistical methods to investigate data, and 3) communicate insights from data analysis to stakeholders. Essentially, it teaches many tools of the trade needed to become a senior data analyst or junior data scientist.
With the Google Business Intelligence Professional Certificate, students can participate in a shorter program that focuses on transforming data into actionable insights for organizations. Consisting of three courses (and lasting about two months), the program helps students learn skills like data modeling, data visualization, and dashboarding–skills that have wide applicability in our data-driven age.
Students can actually take individual courses in these professional certificate programs for free. However, if you would like to receive the certificates, Coursera charges $49 per month (after an initial 7‑day free trial period). That means that the Advanced Data Analytics Professional Certificate, if completed in 6 months, will cost less than $300. And the Business Intelligence Professional Certificate would run about $100. Once students complete a certificate, they can add the credential to their LinkedIn profile, resume, or CV. Likewise, they can connect with 150+ U.S. hiring organizations in Google’s Employer Consortium. If you would like to learn more about Google Career Certificates, you can read this handy page on University of Texas’ website.
Update: Google has also added a new certificate program focused on Cybersecurity. Find out more about the program here.
You can sign up for the programs by clicking on the links in bold above. Each program has a 7‑day free trial.
Note: Open Culture has a partnership with Coursera. If readers enroll in certain Coursera courses and programs, it helps support Open Culture.
Read More...Pink Floyd’s The Dark Side of the Moon Turns 50: Hear It Get Psychoanalyzed by Neuroscientist Daniel Levitin
Coming after the maturation of the market for high-fidelity stereo systems but before the advent of home video, the nineteen-seventies provided just the right cultural and economic conditions for a heroic age of the record album. What’s Going On, Blue, Blood on the Tracks, Exile on Main Street, Born to Run, Rumours, Aja: that these and other seventies releases always rank high on best-of-all-time lists can be no accident. But no other mega-selling album of that decade achieved quite the combination of commercial and critical success as Pink Floyd’s The Dark Side of the Moon, which was originally released fifty years ago yesterday — and which remains on the Billboard charts today.
“In 1973, Pink Floyd was a somewhat known progressive rock band,” writes neuroscientist and music producer Daniel Levitin, but The Dark Side of the Moon “catapulted them into world class rock-star status.”
Its masterful engineering “propelled the music off of any sound system to become an all-encompassing, immersive experience” comprising songs that “flow into one another symphonically, with seamless musical coherence, as though written as part of a single melodic and harmonic gesture. Lyric themes of madness and alienation connect throughout,” enlivened by an “array of new electronic sounds, spatialization, pitch and time bending” as well as “clocks, alarms, chimes, cash registers, footsteps” and other elements not normally heard in rock music.
This description comes from an essay Levitin wrote for the Library of Congress in 2012, when The Dark Side of the Moon was inducted into the US National Recording Registry. For the album’s fiftieth anniversary, National Public Radio’s Morning Edition invited him to psychoanalyze it on-air. “Themes of madness and alienation permeate the record,” he says, making reference to the story of departed Pink Floyd member Syd Barrett. But “we can’t know for sure which specific lyrics were about Barrett, as opposed, more generally, to mental anguish,” a condition bound to afflict anyone too deep into the rock-star lifestyle.
In The Dark Side of the Moon’s lyrics Levitin hears Pink Floyd co-founder Roger Waters’ metaphorical treatment of the difficult decision to fire Barrett, as well as his realization that “life wasn’t going to start later. It had started. And the idea of ‘Time’ was to grasp the reins and start guiding your own destiny.” As on the album as a whole, the theme comes through in not just the words but the soundscape: “Right off the bat, they’re playing with time. You hear that clop-clop sound, like a heartbeat or a clock ticking. And you think that the higher-pitched one is the downbeat. But as soon as the instruments come in, you realize you’re off the beat, and everything’s upside down. And your sense of time is distorted.”
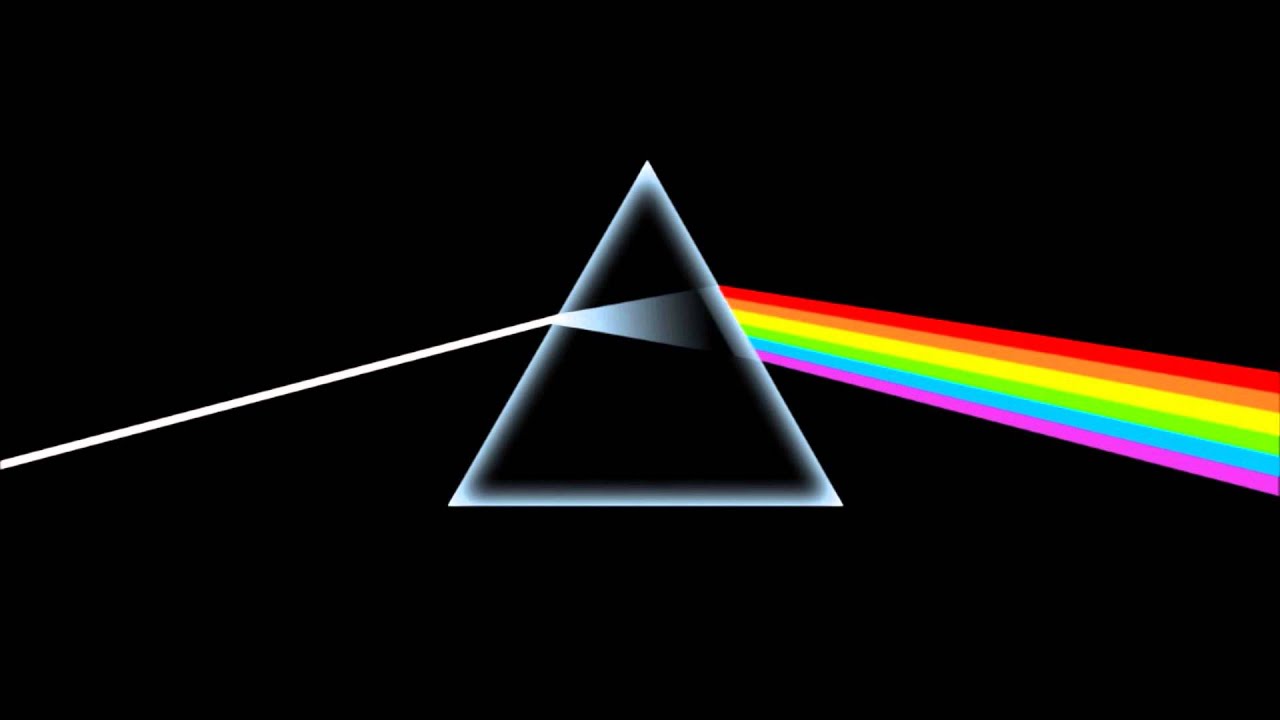
Musical artistry accounts in part for the album’s massive success in part, but only in part. Storm Thorgerson’s iconic cover art, still seen on the walls of college dorm rooms today, also had something to do with its success as both cultural phenomenon and consumer product. But it could hardly have sold more than 45 million copies to date without chancing to hit the zeitgeist at a favorable angle: as Pink Floyd drummer Nick Mason said, it was “not only about being a good album but also about being in the right place at the right time.” And with the heroic age of the album long over, The Dark Side of the Moon — a newly re-recorded version of which Waters announced just this year — isn’t about to be eclipsed.
Related content:
Pink Floyd’s Entire Studio Discography is Now on YouTube: Stream the Studio & Live Albums
The Dark Side of the Moon Project: Watch an 8‑Part Video Essay on Pink Floyd’s Classic Album
Watch Documentaries on the Making of Pink Floyd’s Dark Side of the Moon and Wish You Were Here
Download Pink Floyd’s 1975 Comic Book Program for The Dark Side of the Moon Tour
A Live Studio Cover of Pink Floyd’s The Dark Side of the Moon, Played from Start to Finish
Based in Seoul, Colin Marshall writes and broadcasts on cities, language, and culture. His projects include the Substack newsletter Books on Cities, the book The Stateless City: a Walk through 21st-Century Los Angeles and the video series The City in Cinema. Follow him on Twitter at @colinmarshall or on Facebook.
Read More...Venice’s Canals Have Run Dry During a Winter Drought, Leaving Gondolas Stuck in the Mud
When Venice was way under water a decade ago, we posted about it here on Open Culture. By that time, the City of Canals was supposed to have been protected by MOSE, a $7 billion flood-control system not actually completed until 2021. But a drought struck the following year, and what afflicts Venice right now isn’t an excess of water but a lack of it. “Weeks of dry winter weather have raised concerns that Italy could face another drought after last summer’s emergency,” reports Reuters, “with the Alps having received less than half of their normal snowfall.”
Venice in particular “faces unusually low tides that are making it impossible for gondolas, water taxis and ambulances to navigate some of its famous canals,” a phenomenon blamed on a combination of factors including “the lack of rain, a high pressure system, a full moon, and sea currents.”
The Guardian video above includes, among other dispiriting scenes, a gondolier struggling to maneuver through one of the canals of Venice not quite reduced to muddy ditches. It also shows the contrast with the flooding Venice endured as recently as 2019, which had tourists and locals alike up to their knees in water.
These conditions are striking, but not unprecedented in Venice’s history of over a millennium and a half. “Although they’ve become significantly less frequent over the past two decades due to rising sea levels, Venice still sees one to ten low tides every year,” writes The Local’s Giampietro Vianello. “The city has seen 160 low tides with levels equal to or lower than ‑90cm since 1872, whereas the current tide has ‘only’ reached the ‑70cm mark so far.” Forecasts do indicate a rainfall to come across northern Italy, but at least until then, modern-day Robert Benchleys will have to alter their message back home: “Streets empty of water. Please advise.”
Related content:
How Venice Works: 124 Islands, 183 Canals & 438 Bridges
A Relaxing 3‑Hour Tour of Venice’s Canals
Watch Venice’s New $7 Billion Flood Defense System in Action
Based in Seoul, Colin Marshall writes and broadcasts on cities, language, and culture. His projects include the Substack newsletter Books on Cities, the book The Stateless City: a Walk through 21st-Century Los Angeles and the video series The City in Cinema. Follow him on Twitter at @colinmarshall or on Facebook.
Read More...A Gigantic Violin Floats Down Venice’s Grand Canal with a String Quartet on Top
It looks like something out of a Fellini movie: a string quartet floating down the canals of Venice on a gigantic violin. Not a boat masquerading as a violin, like when you dress up your pet for Halloween and just slap some funny ears and coat on it, but an actual 39-foot long violin, made of several kinds of wood and metal by master boatbuilder/wood sculptor Livio De Marchi.
“Noah’s Violin,” as it is called, did have a tiny motor inside to propel it, and its trip down the Grand Canal was intended as a portent of a post-COVID world. De Marchi told the New York Times that the violin was a “sign of Venice restarting,” and like Noah’s Ark, would bring hope after the deluge.
Musicians on board played works by Vivaldi, who was also an inspiration to the woodworker/boatmaker, and who was likewise born in Venice. The surprise is not so much that a string quartet is playing on top of the violin, but that it all seems so sturdy and safe. There are no hand rails or life jackets to be seen. (According to the Times, wind blew some of the score into the canal, where it was quickly rescued).
De Marchi has made several surreal boats, starting with a large wooden replica of a paper ship, a floating origami crane, a large high-heeled shoe, and recently an all-wood recreation of a Ferrari that puttered up and and down the canal.
The violin boat was followed by crowds in gondolas and other tourist boats, floated about for an hour, and then was docked, where it was blessed by a priest. A museum in China and an Italian company expressed interest in finding the violin-boat a home.
Who knows what might happen to it, but why not strap some powerboat motors on it, hire Apocalyptica and let ‘er rip?
Related Content:
How Venice Works: 124 Islands, 183 Canals & 438 Bridges
A Relaxing 3‑Hour Tour of Venice’s Canals
Ted Mills is a freelance writer on the arts who currently hosts the Notes from the Shed podcast and is the producer of KCRW’s Curious Coast. You can also follow him on Twitter at @tedmills, and/or watch his films here.
Read More...Is the Famous Photo of Lee Harvey Oswald Posing with the Gun Used to Kill JFK a Fake?: 3D Forensic Analysis Reveals the Answer
As long as the 20th century remains in living memory, the assassination of President John F. Kennedy will continue to draw public interest. A great many Americans feel they still haven’t heard the “whole story” behind what happened on November 22, 1963; a few have dedicated their lives to finding out, growing less inclined to accept the possibility of a lone gunman the deeper they get into the documents. But that gunman, Lee Harvey Oswald, does figure directly into some of the material held up as evidence of a conspiracy. Take the “backyard photos” that depict him posing with what was ultimately found to be the very gun used to kill JFK.
Such images would seem strongly to implicate Oswald in the assassination, and the Warren Commission seems to have regarded them in just that way. But for nearly six decades now, some theorists have argued that the backyard photos are fake — an idea that began with Oswald himself, who before his own assassination insisted that he’d never seen them in his life, and that someone had “superimposed” his face onto another body.
The Vox video above lays out the main elements of one particular picture that have been called repeatedly into question: the angles of the shadows, the shape of Oswald’s chin, the length of the gun, and Oswald’s unusual posture.
“In the 1960s and 1970s, forensic experts tried just about everything to test the authenticity of this photo,” says the video’s narrator. They couldn’t find any evidence of fakery, but they didn’t have the 21st-century technology at the command of the UC Berkeley School of Information’s Hany Farid, a well-known specialist in the analysis of digital images. Farid and a team of researchers reconstructed Oswald’s body and weaponry (though not the copies of The Militant and The Worker, two ideologically opposed newspapers, he brandished in his other hand) and found that everything added up, from the seemingly misaligned shadows cast by the sun to the stability of his odd stance. If there was indeed a conspiracy to kill JFK, then, it wasn’t a conspiracy of proto-Photoshoppers.
Related Content:
2,800 JFK Assassination Documents Just Released by the National Archives
November 22, 1963: Watch Errol Morris’ Short Documentary About the Kennedy Assassination
Noam Chomsky on Commemorating the JFK Assassination: It “Would Impress Kim Il-Sung”
Based in Seoul, Colin Marshall writes and broadcasts on cities, language, and culture. His projects include the Substack newsletter Books on Cities, the book The Stateless City: a Walk through 21st-Century Los Angeles and the video series The City in Cinema. Follow him on Twitter at @colinmarshall or on Facebook.
Read More...Google Data Analytics Certificate: 8 Courses Will Help Prepare Students for an Entry-Level Job in 6 Months
During the pandemic, Google launched a series of Career Certificates that will “prepare learners for an entry-level role in under six months.” The new career initiative includes certificates concentrating on Project Management and UX Design. And now also Data Analytics, a burgeoning field that focuses on “the collection, transformation, and organization of data in order to draw conclusions, make predictions, and drive informed decision making.”
Offered on the Coursera platform, the Data Analytics Professional Certificate consists of eight courses, including “Foundations: Data, Data, Everywhere,” “Prepare Data for Exploration,” “Data Analysis with R Programming,” and “Share Data Through the Art of Visualization.” Overall this program “includes over 180 hours of instruction and hundreds of practice-based assessments, which will help you simulate real-world data analytics scenarios that are critical for success in the workplace. The content is highly interactive and exclusively developed by Google employees with decades of experience in data analytics.”
Upon completion, students–even those who haven’t pursued a college degree–can directly apply for jobs (e.g., junior or associate data analyst, database administrator, etc.) with Google and over 130 U.S. employers, including Walmart, Best Buy, and Astreya. You can start a 7‑day free trial and explore the courses here. If you continue beyond the free trial, Google/Coursera will charge $39 USD per month. That translates to about $235 after 6 months, the time estimated to complete the certificate.
Explore the Data Analytics Certificate by watching the video above. Learn more about the overall Google career certificate initiative here. And find other Google professional certificates here.
Note: Open Culture has a partnership with Coursera. If readers enroll in certain Coursera courses and programs, it helps support Open Culture.
Related Content:
Read More...Are We All Getting More Depressed?: A New Study Analyzing 14 Million Books, Written Over 160 Years, Finds the Language of Depression Steadily Rising
The relations between thought, language, and mood have become subjects of study for several scientific fields of late. Some of the conclusions seem to echo religious notions from millennia ago. “As a man thinketh, so he is,” for example, proclaims a famous verse in Proverbs (one that helped spawn a self-help movement in 1903). Positive psychology might agree. “All that we are is the result of what we have thought,” says one translation of the Buddhist Dhammapada, a sentiment that cognitive behavioral therapy might endorse.
But the insights of these traditions — and of social psychology — also show that we’re embedded in webs of connection: we don’t only think alone; we think — and talk and write and read — with others. External circumstances influence mood as well as internal states of mind. Approaching these questions differently, researchers at the Luddy School of Informatics, Computing, and Engineering at Indiana University asked, “Can entire societies become more or less depressed over time?,” and is it possible to read collective changes in mood in the written languages of the past century or so?
The team of scientists, led by Johan Bollen, Indiana University professor of informatics and computing, took a novel approach that brings together tools from at least two fields: large-scale data analysis and cognitive-behavioral therapy (CBT). Since diagnostic criteria for measuring depression have only been around for the past 40 years, the question seemed to resist longitudinal study. But CBT provided a means of analyzing language for markers of “cognitive distortions” — thinking that skews in overly negative ways. “Language is closely intertwined with this dynamic” of thought and mood, the researchers write in their study, “Historical language records reveal a surge of cognitive distortions in recent decades,” published just last month in PNAS.
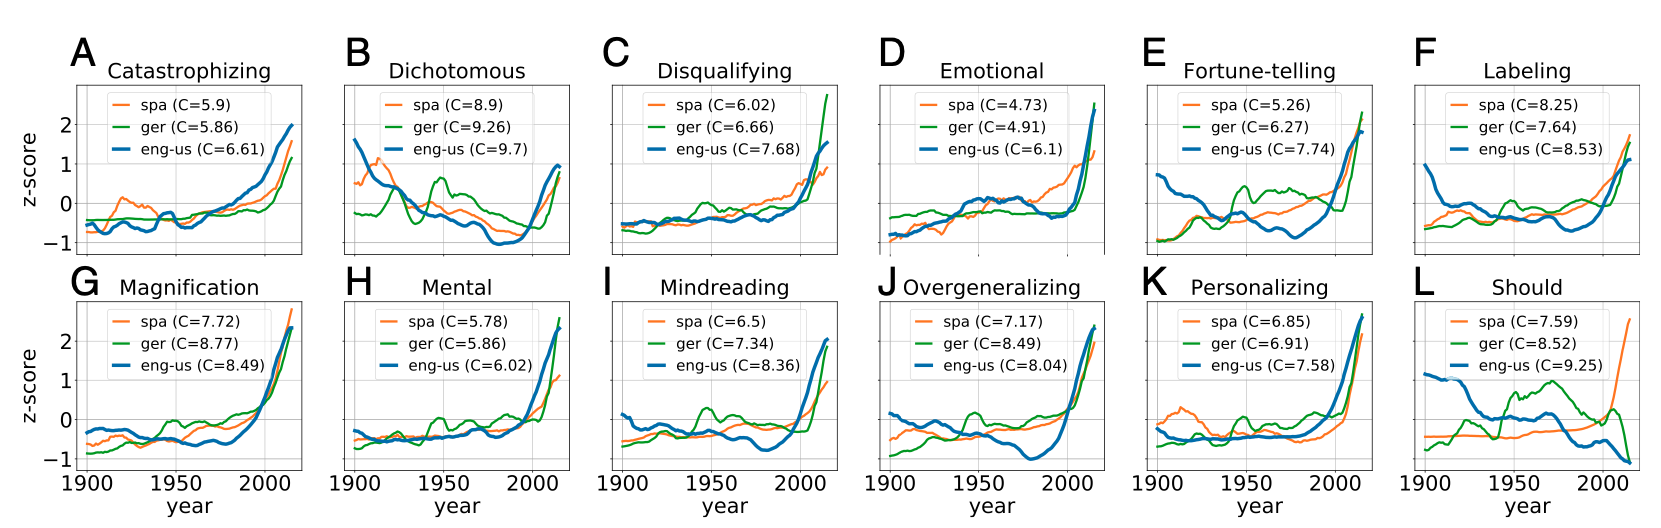
Choosing three languages, English (US), German, and Spanish, the team looked for “short sequences of one to five words (n‑grams), labeled cognitive distortion schemata (CDS).” These words and phrases express negative thought processes like “catastrophizing,” “dichotomous reasoning,” “disqualifying the positive,” etc. Then, the researchers identified the prevalence of such language in a collection of over 14 million books published between 1855 and 2019 and uploaded to Google Books. The study controlled for language and syntax changes during that time and accounted for the increase in technical and non-fiction books published (though it did not distinguish between literary genres).
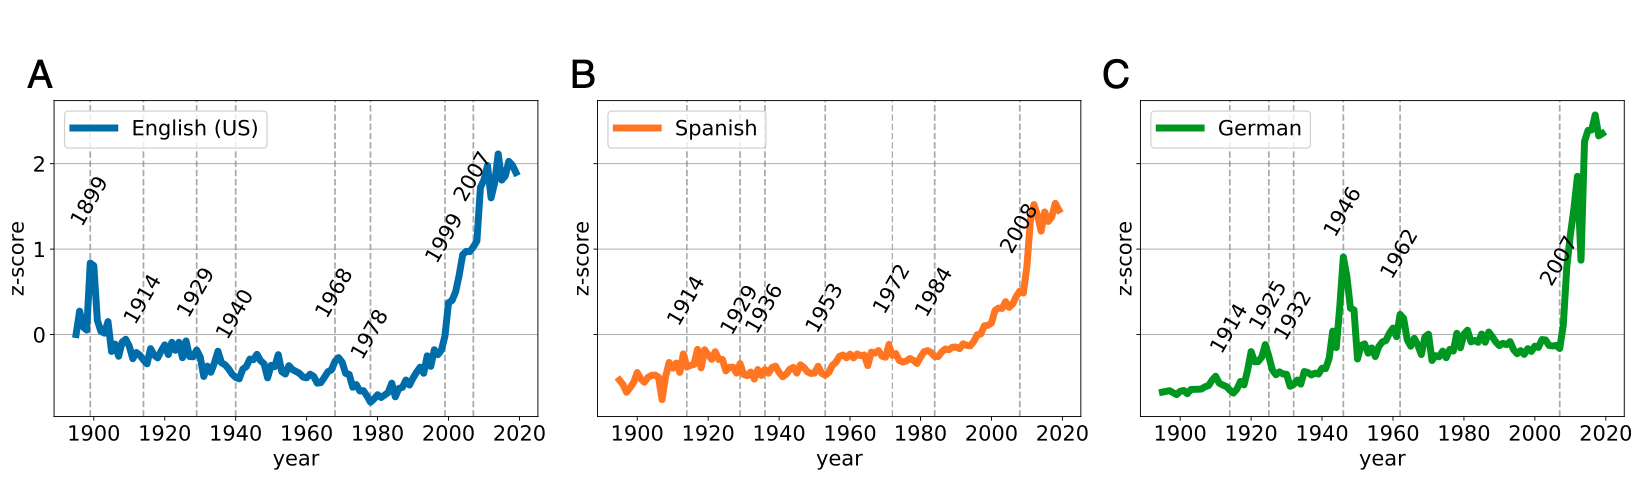
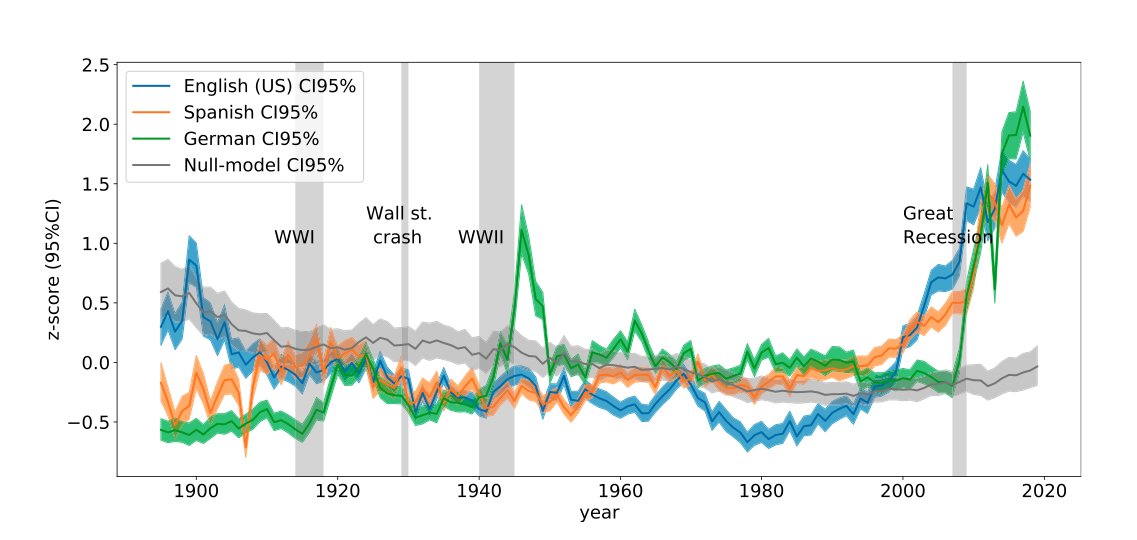
What the scientists found in all three languages was a distinctive “‘hockey stick’ pattern” — a sharp uptick in the language of depression after 1980 and into the present time. The only spikes that come close on the timeline occur in English language books during the Gilded Age and books published in German during and immediately after World War II. (Highly interesting, if unsurprising, findings.) Why the sudden, steep climb in language signifying depressive thinking? Does it actually mark a collective shift in mood, or show how historically oppressed groups have had more access to publishing in the past forty years, and have expressed less satisfaction with the status quo?
While they are careful to emphasize that they “make no causal claims” in the study, the researchers have some ideas about what’s happened, observing for example:
The US surge in CDS prevalence coincides with the late 1970s when wages stopped tracking increasing work productivity. This trend was associated with rises in income inequality to recent levels not seen since the 1930s. This phenomenon has been observed for most developed economies, including Germany, Spain and Latin America.
Other factors cited include the development of the World Wide Web and its facilitation of political polarization, “in particular us-vs.-them thinking… dichotomous reasoning,” and other maladaptive thought patterns that accompany depression. The scale of these developments might be enough to explain a major collective rise in depression, but one commenter offers an additional gloss:
The globe is *Literally* on fire, or historically flooding — Multiple economic crashes barely decades apart — a ghost town of a housing market — a multi-year global pandemic — wealth concentration at the .01% level — terrible pay/COL equations — blocking unionization/workers rights — abusive militarized police, without the restraint or training of actual military — You can’t afford X for a monthly mortgage payment! Pay 1.5x for rent instead! — endless wars for the last… 30…years? 50 if we include stuff like Korea, Cold War, Vietnam… How far has the IMC been milking the gov for funds to make the rich richer? Oh, and a billionaire 3‑way space race to determine who’s got the biggest “rocket”
These sound like reasons for global depression indeed, but the arrow could also go the other way: maybe catastrophic reasoning produced actual catastrophes; black and white thinking led to endless wars, etc…. More study is needed, says Bollen and his colleagues, yet it seems probable, given the data, that “large populations are increasingly stressed by pervasive cultural, economic, and social changes” — changes occurring more rapidly, frequently, and with greater impact on our daily lives than ever before. Read the full study at PNAS.
Related Content:
Josh Jones is a writer and musician based in Durham, NC. Follow him at @jdmagness
Read More...A Relaxing 3‑Hour Tour of Venice’s Canals
Experience Venice in this boat tour through 17 miles (27 km) of canals. “You will see the full Grand Canal going in both directions, navigate through the small canals and under bridges and see sites that you cannot see by walking.” It’s quiet, meditative, a mental escape from the tedium of quarantine life.
Right below, you can find a list of the stops along the way…
1:32 Constitution Bridge
2:02 The Grand Canal (Full Tour)
3:23 Santa Lucia Train Station
13:33 Rialto Bridge
23:28 Ponte dell’Accademia
30:38 Piazza San Marco
36:08 Small Inside Canals & Bridges
41:05 Libreria Acqua Alta
44:08 Campo Santi Giovanni e Paolo
47:16 Open Water — Skip ahead to the next section
57:25 Canal of Saint Peter
58:18 Building Bridges Sculpture
1:09:55 Bridge of Sighs
1:16:15 Rialto Bridge & Grand Canal
1:18:39 Small Inside Canals & Bridges
1:23:04 The Grand Canal
1:27:14 Pont dell’Accademia
1:34:44 Rialto Bridge
1:43:34 Ponte delle Guglie
1:46:04 Tre Archi Bridge
1:48:38 Liberty Bridge (Ponte della Libertà)
1:54:18 Constitution Bridge
1:58:38 Close Call!
2:04:43 Squero di San Trovaso (gondola boatyard)
2:07:23 Grand Canal (short section)
2:10:44 Small Canals and Bridges
2:17:14 Grand Canal (short section)
2:20:14 Magister Canova
2:22:04 Open Water
2:26:14 Small Inside Canals & Bridges
2:30:44 Piazza San Marco
2:33:04 The Grand Canal (Full Tour)
Related Content:
How Venice Works: 124 Islands, 183 Canals & 438 Bridges
Read More...Support Us
We're hoping to rely on loyal readers, rather than erratic ads. Please click the Donate button and support Open Culture. You can use Paypal, Venmo, Patreon, even Crypto! We thank you!

About Us

Open Culture scours the web for the best educational media. We find the free courses and audio books you need, the language lessons & educational videos you want, and plenty of enlightenment in between.
Advertise With Us
FREE UPDATES!
GET OUR DAILY EMAIL
Get the best cultural and educational resources on the web curated for you in a daily email. We never spam. Unsubscribe at any time.
FOLLOW ON SOCIAL MEDIA
Open Culture editor Dan Colman scours the web for the best educational media. He finds the free courses and audio books you need, the language lessons & movies you want, and plenty of enlightenment in between.
Advertise With Us